None
Fort Oglethorpe, GA 30742
$795,000D-
49 bd · 49.0 ba ·
5,004 sqft ·
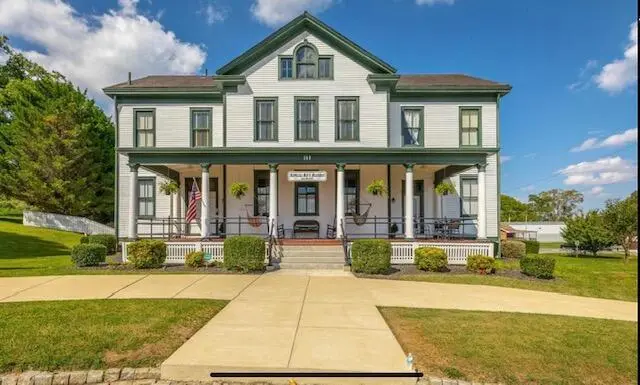
Built 1915
· MultiFamily
· Active
· 115 DOM
Cashflow @ list (25.0% down · 7.5%)
Estimated rent
$6,202/mo
Mortgage (P&I)
−$4,169
Tax + insurance
−$1,325
HOA
−$0
Vac / Maint / Mgmt
−$1,302
Net cashflow
$-594/mo
Annual
$-7,134/yr
Cap rate
5.40%
Cash-on-cash
-3.20%
DSCR
0.86
1% rule
0.78%
Cash to close
$222,600
Investor read
- This is a 4×1bd/1ba + 3×?bd/1ba units multifamily listed at $795k. Condition is rated good.
- At list price, monthly cash flow is $-594 ($-7k/yr) — negative. Per door: $-85/mo.
- To cash-flow at today's rent, offer at most $709k (10.8% below list).
- To meet the 1% rule (rent ≥ 1% of price), the offer needs to be $620k (22.0% below list).
- It's been on market 115 days — a 9% lower offer ($723k) is reasonable based on typical stale-listing flexibility.
- Recommended offer: $620k (22.0% below list) — sets the bar for 1% rule.
- Local home prices are declining (-3.0%/yr); year-one equity from $5k of loan paydown is wiped out by about $24k of value loss. Plan a longer hold.
- Location reads 67/100 on livability (#166 in GA) — a middle-class / working-renter tenant base. Strengths: cost of living A+, housing A+; Watch: schools D-, amenities F, commute F.
- Catoosa County (suburban): math 36% / reading 41% proficiency, ranked #49 of 174 in GA (top 28%) — families likely to look elsewhere, expect single-tenant / working-renter base with shorter leases.
- Watch-outs: built in 1915 — expect roof / HVAC / electrical / plumbing capex.
- Market conditions: 59 active listings in the ZIP; 848 units permitted in Catoosa County in 2024 (256 in 5+ unit buildings).
- Catoosa County population projected at +5% by 2050 — modest demand growth; plan on rents tracking national, not racing it.
- Climate carrying-cost: extreme-heat days projected 7→21/yr by 2055 (HVAC capex compounding) — expect insurance premiums to compound above CPI over the hold.
- Cap rate 5.4% vs local median 3.4% in Fort Oglethorpe — top-decile yield for the area; either an underpriced asset or a hidden risk that comps aren't pricing in. Stress-test before assuming the spread holds.
- At $6,202/mo this rent would consume 151% of the median local household income ($49k/yr) (locally 267% of renters already pay >50% of income on rent) — very limited rent-growth headroom before tenants either downsize or default.
Questions for listing agent
- What do current leases actually rent for vs. the listed asking? Can we see a recent rent roll and the last 12 months of T-12 income?
- It's been on market 115 days. Have you received any prior offers? Is the seller open to a 22% concession, seller financing, or rate buy-down credit?
- Can we see the unit-by-unit rent roll, current vacancy, and any below-market leases? What's the average tenancy length?
- What capital expenditures (roof, boiler, parking lot, exteriors) have been made in the last 5 years, and what's planned in the next 2?
- Built in 1915 — when were the roof, HVAC, electrical panel, plumbing, and water heater last replaced?
- Why hasn't it sold? Are there any deal-killer items the seller is aware of (foundation, flood, title, zoning, code violations)?
- Is there a deadline driving the sale (1031 exchange, divorce, estate, relocation)? That informs how much negotiation room exists.
- Schools are D-rated, which usually means shorter tenancies and higher turnover. Who's the typical renter profile here, and what's been the actual vacancy rate?
CashFlowRE · CFR-H6CBRC9GF88K7M
· Data 2 days ago
cashflowre.app · 2026-05-29