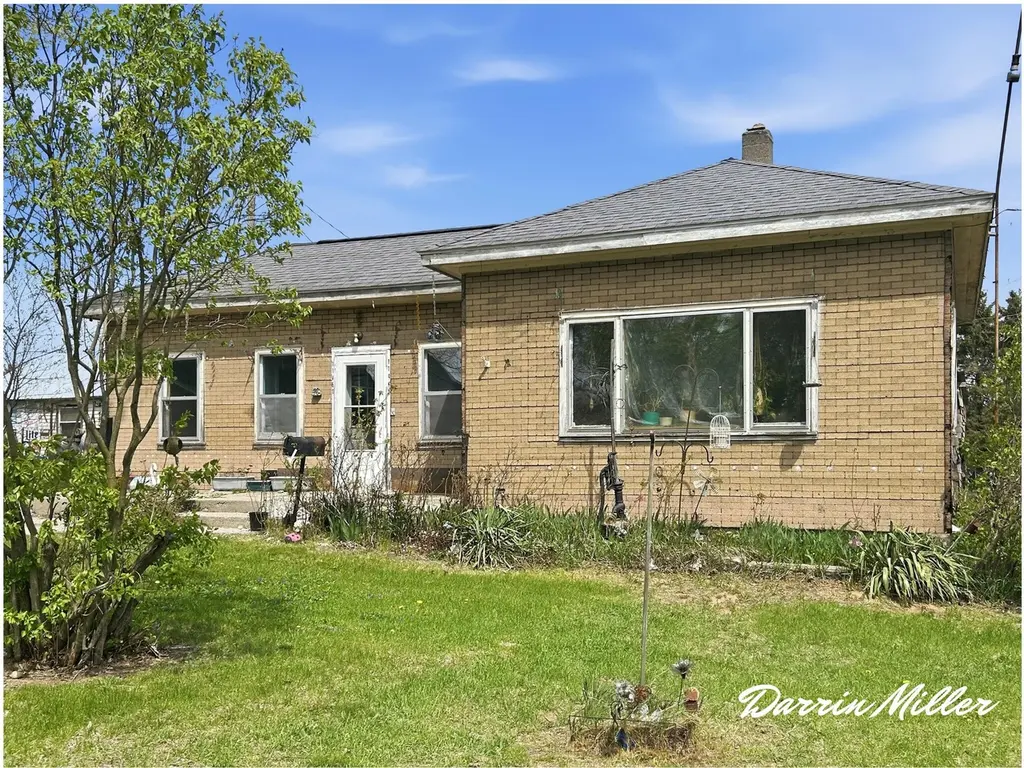
11460 5 Mile Rd
Hinton, MI 49336
$119,900C+
3 bd · 1.0 ba ·
972 sqft ·
Built 1800
· SingleFamily
· Active
· 38 DOM
Cashflow @ list (25.0% down · 7.5%)
Estimated rent
$1,522/mo
Mortgage (P&I)
−$629
Tax + insurance
−$200
HOA
−$0
Vac / Maint / Mgmt
−$320
Net cashflow
$374/mo
Annual
$4,488/yr
Cap rate
10.04%
Cash-on-cash
13.37%
DSCR
1.59
1% rule
1.27%
Cash to close
$33,572
Investor read
- This is a 3-bed/1.0-bath single-family listed at $120k.
- At list price, monthly cash flow is $374 ($4k/yr) — positive.
- The deal already cash-flows at list — no discount required.
- Meets the 1% rule at list price ($2k rent vs $120k).
- It's been on market 38 days — a 3% lower offer ($116k) is reasonable based on typical stale-listing flexibility.
- Recommended offer: $116k (3.0% below list) — sets the bar for market timing.
- Local home prices are declining (-3.0%/yr); year-one equity from $829 of loan paydown is wiped out by about $4k of value loss. Plan a longer hold.
- Location reads: area grade C — affects rentability + tenant quality, not the cash-flow math above.
- Lakeview Community Schools (Montcalm) (rural): math 28% / reading 44% proficiency, ranked #281 of 540 in MI (top 52%) — families likely to look elsewhere, expect single-tenant / working-renter base with shorter leases.
- Zoned schools: Lakeview Elementary School (math 54% / reading 64%, grade B-, #200 of 1,397 statewide, top 16%, 326 students, 70% FRL); Lakeview Middle School (math 24% / reading 39%, grade F, #323 of 493 statewide, top 66%, 338 students, 66% FRL); Lakeview High School (math 27% / reading 47%, grade F, #334 of 713 statewide, top 51%, 366 students, 53% FRL) — zoned schools average 63% FRL vs 45% district-wide (18 pts higher); higher-poverty schools than district average — tighter screening recommended.
- Watch-outs: built in 1800 — expect roof / HVAC / electrical / plumbing capex.
- Market conditions: 26 active listings in the ZIP; 116 units permitted in Mecosta County in 2024 (0 in 5+ unit buildings).
- Mecosta County population projected to shrink 9% by 2050 — rents likely to lag national; underwrite the cash flow, not the appreciation.
- 6 sale attempts since 5y ago with the ask held roughly flat each time — persistent listings suggest the price (not the market) is what's stuck; bring a comps-based counter.
- Current owner paid $75k; list at $120k implies a 60% gain — meaningful room to come down on a strong offer.
- At projected returns (-3.0% appreciation + 3.0% rent growth), your $34k cash investment doubles in ~9 years — after that, you're playing with house money.
Questions for listing agent
- It's been on market 38 days. Have you received any prior offers? Is the seller open to a 3% concession, seller financing, or rate buy-down credit?
- Built in 1800 — when were the roof, HVAC, electrical panel, plumbing, and water heater last replaced?
- Is there a deadline driving the sale (1031 exchange, divorce, estate, relocation)? That informs how much negotiation room exists.
- What's the average days-on-market for RENTAL listings here right now (not sales)? A rising rental-DOM trend means longer vacancies and softer asking-rent achievability than the comps imply.
- What's the recent tenant-quality profile in this submarket — average credit score on applications, eviction rate, late-payment / NSF rate, and stable-employment percentage? A property-management company in the area should have these aggregated.
- How much new for-sale + rental construction is in the pipeline within 1–3 miles? Heavy new supply typically softens prices + rents 12–24 months out; constrained supply supports both.
CashFlowRE · CFR-H8BFGB06V9E1DW
· Data 16 h ago
cashflowre.app · 2026-05-29