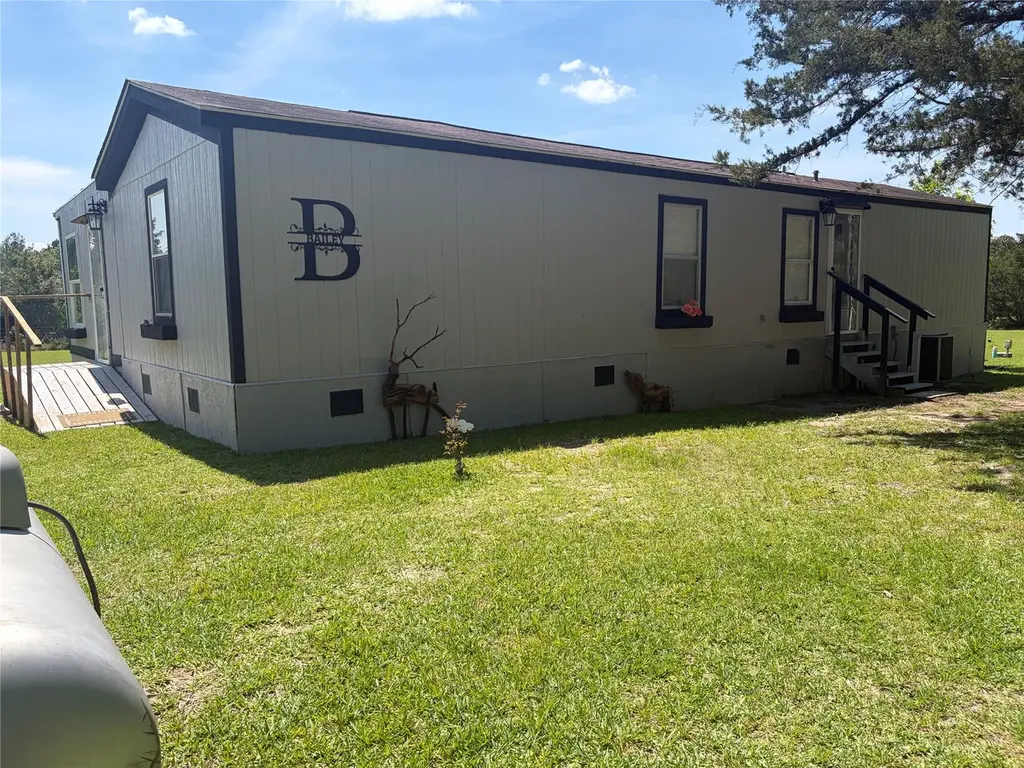
585 Hunter Rd
Cedar Point, TX 77351
$99,900B-
2 bd · 2.0 ba ·
1,164 sqft ·
Built 2006
· Land
· Active
· 43 DOM
Cashflow @ list (25.0% down · 7.5%)
Estimated rent
$1,283/mo
Mortgage (P&I)
−$524
Tax + insurance
−$73
HOA
−$0
Vac / Maint / Mgmt
−$269
Net cashflow
$417/mo
Annual
$4,999/yr
Cap rate
11.30%
Cash-on-cash
17.87%
DSCR
1.80
1% rule
1.28%
Cash to close
$27,972
Investor read
- This is a 2-bed/2.0-bath land listed at $100k.
- At list price, monthly cash flow is $417 ($5k/yr) — positive.
- The deal already cash-flows at list — no discount required.
- Meets the 1% rule at list price ($1k rent vs $100k).
- It's been on market 43 days — a 3% lower offer ($97k) is reasonable based on typical stale-listing flexibility.
- Recommended offer: $97k (3.0% below list) — sets the bar for market timing.
- Local home prices are declining (-3.0%/yr); year-one equity from $691 of loan paydown is wiped out by about $3k of value loss. Plan a longer hold.
- Location reads 49/100 on livability (#1,509 in TX) — a working-class tenant base; expect higher turnover. Strengths: cost of living A+, housing A+, crime A; Watch: amenities F, commute F, employment F.
- Livingston ISD (rural): math 38% / reading 39% proficiency, ranked #459 of 826 in TX (top 56%) — families likely to look elsewhere, expect single-tenant / working-renter base with shorter leases.
- Zoned schools: Livingston J H (math 30% / reading 32%, grade F, #1,015 of 1,662 statewide, top 62%, 893 students, 62% FRL); Livingston H S (math 35% / reading 46%, grade F, #798 of 1,632 statewide, top 49%, 1,128 students, 51% FRL) — zoned schools at 57% FRL track the district average.
- Market conditions: 1186 active listings in the ZIP; 769 units permitted in Polk County in 2024 (0 in 5+ unit buildings).
- Polk County population projected at +16% by 2050 — long-run rental-demand tailwind backs the buy-and-hold thesis.
- 2 sale attempts; this cycle's ask has dropped $30k (23%) from the opening price — seller is motivated, your offer sets the floor, not the list.
- At projected returns (-3.0% appreciation + 3.0% rent growth), your $28k cash investment doubles in ~7 years — after that, you're playing with house money.
- Cap rate 11.3% vs local median 3.8% in Cedar Point — top-decile yield for the area; either an underpriced asset or a hidden risk that comps aren't pricing in. Stress-test before assuming the spread holds.
Questions for listing agent
- It's been on market 43 days. Have you received any prior offers? Is the seller open to a 3% concession, seller financing, or rate buy-down credit?
- Is there a deadline driving the sale (1031 exchange, divorce, estate, relocation)? That informs how much negotiation room exists.
- Schools are F-rated, which usually means shorter tenancies and higher turnover. Who's the typical renter profile here, and what's been the actual vacancy rate?
- What's the average days-on-market for RENTAL listings here right now (not sales)? A rising rental-DOM trend means longer vacancies and softer asking-rent achievability than the comps imply.
- What's the recent tenant-quality profile in this submarket — average credit score on applications, eviction rate, late-payment / NSF rate, and stable-employment percentage? A property-management company in the area should have these aggregated.
- How much new for-sale + rental construction is in the pipeline within 1–3 miles? Heavy new supply typically softens prices + rents 12–24 months out; constrained supply supports both.
CashFlowRE · CFR-H9CP09599FXHCS
· Data 2 days ago
cashflowre.app · 2026-05-29