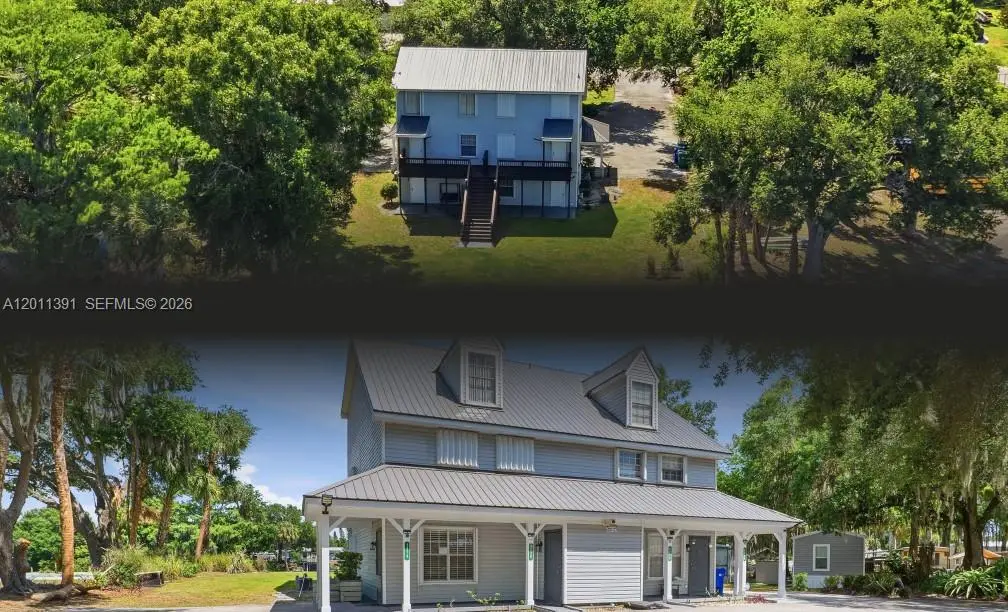
207 SE 6th Ave
Okeechobee, FL 34974
$890,000F
6 bd · 6.0 ba ·
3,873 sqft ·
Built 1988
· MultiFamily
· Active
· 51 DOM
Cashflow @ list (25.0% down · 7.5%)
Estimated rent
$5,486/mo
Mortgage (P&I)
−$4,667
Tax + insurance
−$1,109
HOA
−$0
Vac / Maint / Mgmt
−$1,152
Net cashflow
$-1,442/mo
Annual
$-17,303/yr
Cap rate
4.35%
Cash-on-cash
-6.94%
DSCR
0.69
1% rule
0.62%
Cash to close
$249,200
Investor read
- This is a 4 × 2-bed/1-bath units multifamily listed at $890k.
- At list price, monthly cash flow is $-1k ($-17k/yr) — negative. Per door: $-360/mo.
- To cash-flow at today's rent, offer at most $635k (28.6% below list).
- To meet the 1% rule (rent ≥ 1% of price), the offer needs to be $549k (38.4% below list).
- It's been on market 51 days — a 3% lower offer ($863k) is reasonable based on typical stale-listing flexibility.
- Recommended offer: $549k (38.4% below list) — sets the bar for 1% rule.
- Local home prices are declining (-3.0%/yr); year-one equity from $6k of loan paydown is wiped out by about $27k of value loss. Plan a longer hold.
- Location reads 77/100 on livability (#210 in FL, #3,234 nationally) — a middle-class / working-renter tenant base. Strengths: cost of living A+, housing A+, health & safety A+; Watch: employment C-, amenities F, commute F.
- Okeechobee (town): math 44% / reading 42% proficiency, ranked #58 of 73 in FL (top 80%) — families likely to look elsewhere, expect single-tenant / working-renter base with shorter leases; 72% free/reduced lunch — lower-income household profile, screen leases tightly.
- Market conditions: 406 active listings in the ZIP; 18 units permitted in Okeechobee County in 2024 (0 in 5+ unit buildings).
- Okeechobee County population projected at -21% by 2050 — secular population decline; favor cash flow + early exit over multi-decade hold.
- 2 sale attempts since 12y ago; this cycle's ask has dropped $99k (10%) from the opening price — seller is motivated, your offer sets the floor, not the list.
- Current owner paid $150k; list at $890k implies a 493% gain — meaningful room to come down on a strong offer.
- Climate carrying-cost: severe wind risk, 99% chance of damaging wind over 30y; extreme-heat days projected 7→24/yr by 2055 (HVAC capex compounding) — expect insurance premiums to compound above CPI over the hold.
- At $5,486/mo this rent would consume 124% of the median local household income ($53k/yr) (locally 399% of renters already pay >50% of income on rent) — very limited rent-growth headroom before tenants either downsize or default.
Questions for listing agent
- What do current leases actually rent for vs. the listed asking? Can we see a recent rent roll and the last 12 months of T-12 income?
- It's been on market 51 days. Have you received any prior offers? Is the seller open to a 38% concession, seller financing, or rate buy-down credit?
- Can we see the unit-by-unit rent roll, current vacancy, and any below-market leases? What's the average tenancy length?
- What capital expenditures (roof, boiler, parking lot, exteriors) have been made in the last 5 years, and what's planned in the next 2?
- Is there a deadline driving the sale (1031 exchange, divorce, estate, relocation)? That informs how much negotiation room exists.
- The area grade is low — what's the realistic commute time and amenity access for the typical tenant pool here? Any planned neighborhood developments (good or bad) we should know about?
- What's the average days-on-market for RENTAL listings here right now (not sales)? A rising rental-DOM trend means longer vacancies and softer asking-rent achievability than the comps imply.
- What's the recent tenant-quality profile in this submarket — average credit score on applications, eviction rate, late-payment / NSF rate, and stable-employment percentage? A property-management company in the area should have these aggregated.
CashFlowRE · CFR-H9DMHB29Z1B24V
· Data 14 h ago
cashflowre.app · 2026-05-29