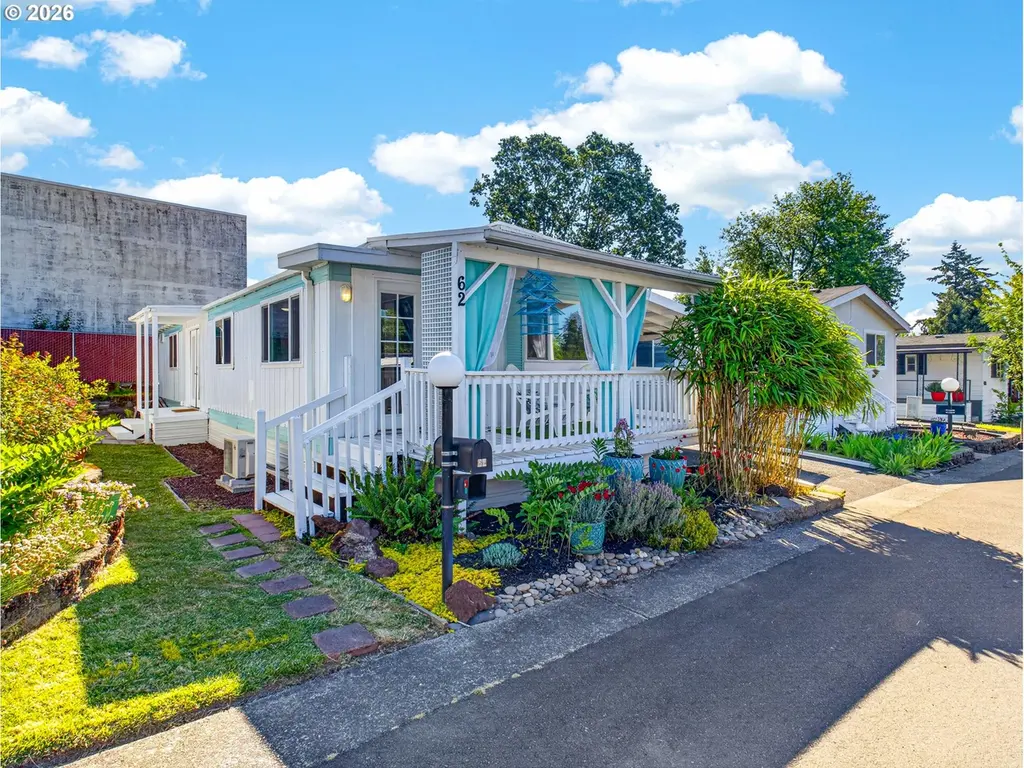
3500 SE Concord Rd #62
Oak Grove, OR 97267
$69,000B
2 bd · 1.0 ba ·
922 sqft ·
Built 1966
· Other
· Pending
· 3 DOM
Cashflow @ list (25.0% down · 7.5%)
Estimated rent
$1,693/mo
Mortgage (P&I)
−$362
Tax + insurance
−$115
HOA
−$0
Vac / Maint / Mgmt
−$356
Net cashflow
$861/mo
Annual
$10,330/yr
Cap rate
21.26%
Cash-on-cash
53.47%
DSCR
3.38
1% rule
2.45%
Cash to close
$19,320
Investor read
- This is a 2-bed/1.0-bath other listed at $69k.
- At list price, monthly cash flow is $861 ($10k/yr) — positive.
- The deal already cash-flows at list — no discount required.
- Meets the 1% rule at list price ($2k rent vs $69k).
- Only 3 days on market — expect competitive offers; lowballing is unlikely to land.
- Local home prices are declining (-3.0%/yr); year-one equity from $477 of loan paydown is wiped out by about $2k of value loss. Plan a longer hold.
- Location reads 84/100 on livability (#37 in OR, #832 nationally) — a professional / high-income tenant draw. Strengths: amenities A+, commute A+, health & safety A+; Watch: cost of living F.
- North Clackamas SD 12 (suburban): math 29% / reading 43% proficiency, ranked #22 of 58 in OR (top 38%) — families likely to look elsewhere, expect single-tenant / working-renter base with shorter leases.
- Zoned schools: Riverside Elementary School (math 15% / reading 24%, grade F, #366 of 412 statewide, top 91%, 331 students, 70% FRL); Alder Creek Middle School (math 13% / reading 36%, grade F, #108 of 128 statewide, top 89%, 846 students, 49% FRL); Putnam High School (math 34% / reading 74%, grade C-, #30 of 143 statewide, top 20%, 1,106 students, 38% FRL) — zoned schools average 53% FRL vs 34% district-wide (18 pts higher); higher-poverty schools than district average — tighter screening recommended.
- Market conditions: Rents flat; 176 active listings in the ZIP; 28 comparable units currently listed for rent nearby; rentals at typical pace (median 25d on market — plan ~3-4 weeks tenant-placement turnaround); solid renter incomes; 946 units permitted in Clackamas County in 2024 (188 in 5+ unit buildings).
- Clackamas County population projected at +25% by 2050 — long-run rental-demand tailwind backs the buy-and-hold thesis.
- At projected returns (-3.0% appreciation + 0.8% rent growth), your $19k cash investment doubles in ~3 years — after that, you're playing with house money.
- Cap rate 21.3% vs local median 2.6% in Oak Grove — top-decile yield for the area; either an underpriced asset or a hidden risk that comps aren't pricing in. Stress-test before assuming the spread holds.
Questions for listing agent
- Built in 1966 — when were the roof, HVAC, electrical panel, plumbing, and water heater last replaced?
- Is there a deadline driving the sale (1031 exchange, divorce, estate, relocation)? That informs how much negotiation room exists.
- What's the average days-on-market for RENTAL listings here right now (not sales)? A rising rental-DOM trend means longer vacancies and softer asking-rent achievability than the comps imply.
- What's the recent tenant-quality profile in this submarket — average credit score on applications, eviction rate, late-payment / NSF rate, and stable-employment percentage? A property-management company in the area should have these aggregated.
- How much new for-sale + rental construction is in the pipeline within 1–3 miles? Heavy new supply typically softens prices + rents 12–24 months out; constrained supply supports both.
CashFlowRE · CFR-HCP133CRGX5TM9
· Data 1 week ago
cashflowre.app · 2026-05-29