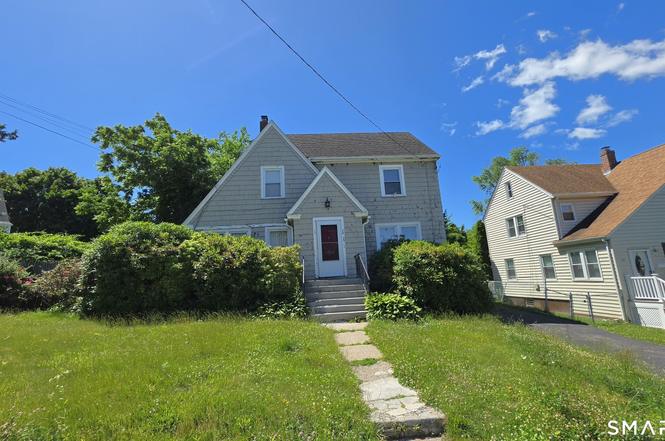
57 Coolidge St
Hartford, CT 06106
$215,000C+
3 bd · 1.5 ba ·
1,765 sqft ·
Built 1939
· SingleFamily
· Active
· 3 DOM
Cashflow @ list (25.0% down · 7.5%)
Estimated rent
$2,531/mo
Mortgage (P&I)
−$1,127
Tax + insurance
−$476
HOA
−$0
Vac / Maint / Mgmt
−$531
Net cashflow
$395/mo
Annual
$4,744/yr
Cap rate
8.50%
Cash-on-cash
7.88%
DSCR
1.35
1% rule
1.18%
Cash to close
$60,200
Investor read
- This is a 3-bed/1.5-bath single-family listed at $215k.
- At list price, monthly cash flow is $395 ($5k/yr) — positive.
- The deal already cash-flows at list — no discount required.
- Meets the 1% rule at list price ($3k rent vs $215k).
- Only 3 days on market — expect competitive offers; lowballing is unlikely to land.
- In year one you build about $4k of equity ($1k loan paydown + $3k appreciation (1.4% local appreciation)).
- Location reads 76/100 on livability (#58 in CT, #3,553 nationally) — a middle-class / working-renter tenant base. Strengths: amenities A+, commute A+, health & safety A+; Watch: schools D-, crime F, employment F.
- Hartford School District (urban): math 13% / reading 21% proficiency, ranked #150 of 153 in CT (top 98%) — low school quality limits family demand, transient renter base, plan for 1-2y turnover; 84% free/reduced lunch — lower-income household profile, screen leases tightly.
- Watch-outs: built in 1939 — expect roof / HVAC / electrical / plumbing capex.
- Market conditions: Rents rising (+2.4%/yr); 62 active listings in the ZIP; 4 comparable units currently listed for rent nearby; rentals leasing fast (median 5d on market — plan ~1-2 weeks tenant-placement turnaround); 1,867 units permitted in Capitol Planning Region in 2024 (1,399 in 5+ unit buildings).
- Current owner paid $105k; list at $215k implies a 105% gain — meaningful room to come down on a strong offer.
- At projected returns (1.4% appreciation + 2.4% rent growth), your $60k cash investment doubles in ~6 years — after that, you're playing with house money.
- By year 8, paydown + projected appreciation supports a ~$34k cash-out refi (75% LTV) — recoverable capital for the next deal without selling this one.
- Climate carrying-cost: major wind risk, 27% chance of damaging wind over 30y; extreme-heat days projected 7→16/yr by 2055 (HVAC capex compounding) — expect insurance premiums to compound above CPI over the hold.
- At $2,531/mo this rent would consume 66% of the median local household income ($46k/yr) (locally 3400% of renters already pay >50% of income on rent) — very limited rent-growth headroom before tenants either downsize or default.
Questions for listing agent
- Built in 1939 — when were the roof, HVAC, electrical panel, plumbing, and water heater last replaced?
- Is there a deadline driving the sale (1031 exchange, divorce, estate, relocation)? That informs how much negotiation room exists.
- Schools are D-rated, which usually means shorter tenancies and higher turnover. Who's the typical renter profile here, and what's been the actual vacancy rate?
- Crime grade is F in this area — have there been break-ins, vandalism, or insurance claims at this property in the last 3 years? What carrier currently insures it and at what premium?
- What's the average days-on-market for RENTAL listings here right now (not sales)? A rising rental-DOM trend means longer vacancies and softer asking-rent achievability than the comps imply.
- What's the recent tenant-quality profile in this submarket — average credit score on applications, eviction rate, late-payment / NSF rate, and stable-employment percentage? A property-management company in the area should have these aggregated.
- How much new for-sale + rental construction is in the pipeline within 1–3 miles? Heavy new supply typically softens prices + rents 12–24 months out; constrained supply supports both.
CashFlowRE · CFR-HEM6JKD3T6GXZ4
· Data 3 days ago
cashflowre.app · 2026-05-29