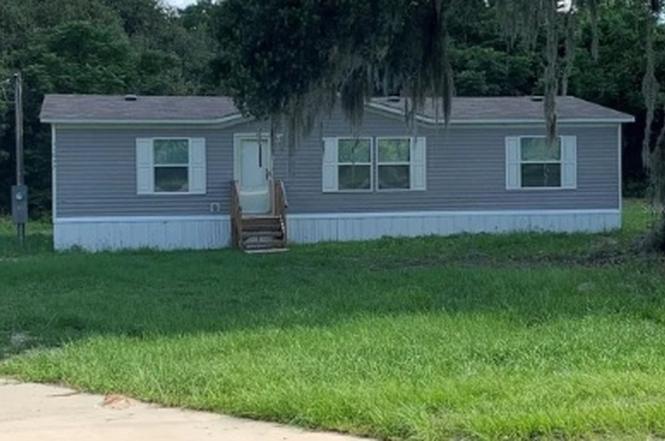
11057 SE 132nd Pl
Ocklawaha, FL 32179
$5,000D
3 bd · 2.0 ba ·
1,344 sqft ·
Built 2015
· Manufactured
· Active
· 7 DOM
Cashflow @ list (25.0% down · 7.5%)
Estimated rent
$1,830/mo
Mortgage (P&I)
−$26
Tax + insurance
−$8
HOA
−$0
Vac / Maint / Mgmt
−$384
Net cashflow
$1,411/mo
Annual
$16,934/yr
Cap rate
344.96%
Cash-on-cash
1209.54%
DSCR
54.82
1% rule
36.60%
Cash to close
$1,400
Investor read
- This is a 3-bed/2.0-bath manufactured listed at $5k.
- At list price, monthly cash flow is $1k ($17k/yr) — positive.
- The deal already cash-flows at list — no discount required.
- Meets the 1% rule at list price ($2k rent vs $5k).
- Only 7 days on market — expect competitive offers; lowballing is unlikely to land.
- Local home prices are declining (-3.0%/yr); year-one equity from $35 of loan paydown is wiped out by about $150 of value loss. Plan a longer hold.
- Location reads: area grade D — affects rentability + tenant quality, not the cash-flow math above.
- Marion (rural): math 42% / reading 43% proficiency, ranked #61 of 73 in FL (top 84%) — families likely to look elsewhere, expect single-tenant / working-renter base with shorter leases; 61% free/reduced lunch — lower-income household profile, screen leases tightly.
- Market conditions: 426 active listings in the ZIP; 3 comparable units currently listed for rent nearby; rentals at typical pace (median 15d on market — plan ~3-4 weeks tenant-placement turnaround); 7,071 units permitted in Marion County in 2024 (534 in 5+ unit buildings).
- Marion County population projected at +13% by 2050 — modest demand growth; plan on rents tracking national, not racing it.
- 5 sale attempts since 3y ago with the ask held roughly flat each time — persistent listings suggest the price (not the market) is what's stuck; bring a comps-based counter.
- At projected returns (-3.0% appreciation + 3.0% rent growth), your $1k cash investment doubles in ~1 year — after that, you're playing with house money.
- Climate carrying-cost: severe wind risk, 99% chance of damaging wind over 30y; extreme-heat days projected 7→21/yr by 2055 (HVAC capex compounding) — expect insurance premiums to compound above CPI over the hold.
- Cap rate 345.0% vs local median 5.1% in Ocklawaha — top-decile yield for the area; either an underpriced asset or a hidden risk that comps aren't pricing in. Stress-test before assuming the spread holds.
- At $1,830/mo this rent would consume 47% of the median local household income ($47k/yr) (locally 303% of renters already pay >50% of income on rent) — very limited rent-growth headroom before tenants either downsize or default.
Questions for listing agent
- Is there a deadline driving the sale (1031 exchange, divorce, estate, relocation)? That informs how much negotiation room exists.
- The area grade is low — what's the realistic commute time and amenity access for the typical tenant pool here? Any planned neighborhood developments (good or bad) we should know about?
- What's the average days-on-market for RENTAL listings here right now (not sales)? A rising rental-DOM trend means longer vacancies and softer asking-rent achievability than the comps imply.
- What's the recent tenant-quality profile in this submarket — average credit score on applications, eviction rate, late-payment / NSF rate, and stable-employment percentage? A property-management company in the area should have these aggregated.
- How much new for-sale + rental construction is in the pipeline within 1–3 miles? Heavy new supply typically softens prices + rents 12–24 months out; constrained supply supports both.
CashFlowRE · CFR-HGSX0XE1HSSHQB
· Data 2 days ago
cashflowre.app · 2026-05-29