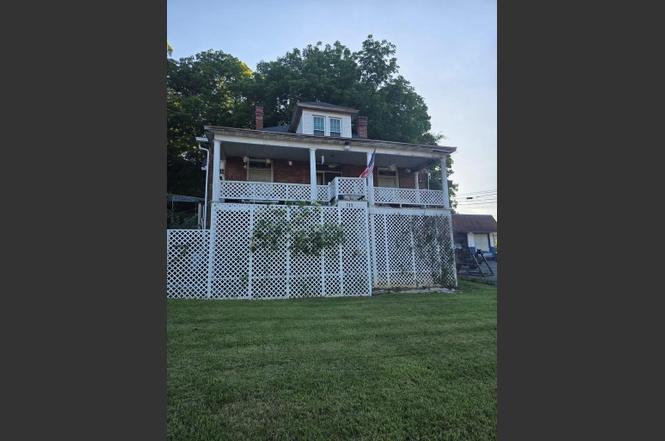
713 Virginia Ave
Bluefield, VA 24605
$95,000B
3 bd · 1.0 ba ·
1,986 sqft ·
Built 1900
· SingleFamily
· Active
· 5 DOM
Cashflow @ list (25.0% down · 7.5%)
Estimated rent
$1,105/mo
Mortgage (P&I)
−$498
Tax + insurance
−$148
HOA
−$0
Vac / Maint / Mgmt
−$232
Net cashflow
$227/mo
Annual
$2,723/yr
Cap rate
10.00%
Cash-on-cash
13.24%
DSCR
1.59
1% rule
1.16%
Cash to close
$26,600
Investor read
- This is a 3-bed/1.0-bath single-family listed at $95k.
- At list price, monthly cash flow is $227 ($3k/yr) — positive.
- The deal already cash-flows at list — no discount required.
- Meets the 1% rule at list price ($1k rent vs $95k).
- Only 5 days on market — expect competitive offers; lowballing is unlikely to land.
- Local home prices are declining (-3.0%/yr); year-one equity from $657 of loan paydown is wiped out by about $3k of value loss. Plan a longer hold.
- Location reads 62/100 on livability (#408 in VA) — a middle-class / working-renter tenant base. Strengths: cost of living A+, housing A+, crime B; Watch: employment C-, amenities F, commute F.
- Tazewell County Public School District (town): math 67% / reading 78% proficiency, ranked #21 of 131 in VA (top 16%) — strong family-tenant draw, lease renewals of 3-5y typical.
- Zoned schools: Dudley Primary (357 students, 82% FRL); Graham Middle (math 65% / reading 78%, grade A, #72 of 342 statewide, top 22%, 372 students, 82% FRL); Graham High (math 92% / reading 98%, grade A+, #1 of 319 statewide, top 0%, 529 students, 83% FRL) — zoned schools average 83% FRL vs 47% district-wide (36 pts higher); higher-poverty schools than district average — tighter screening recommended.
- Watch-outs: flood insurance adds $66/mo; built in 1900 — expect roof / HVAC / electrical / plumbing capex.
- Market conditions: 46 active listings in the ZIP; 4 units permitted in Tazewell County in 2024 (0 in 5+ unit buildings).
- Tazewell County population projected at -30% by 2050 — secular population decline; favor cash flow + early exit over multi-decade hold.
- Climate carrying-cost: severe flood risk — expect insurance premiums to compound above CPI over the hold.
- Cap rate 10.0% vs local median 4.1% in Bluefield — top-decile yield for the area; either an underpriced asset or a hidden risk that comps aren't pricing in. Stress-test before assuming the spread holds.
Questions for listing agent
- Built in 1900 — when were the roof, HVAC, electrical panel, plumbing, and water heater last replaced?
- What's the actual annual flood-insurance premium (NFIP or private), and is the property in a SFHA with mandatory coverage?
- Is there a deadline driving the sale (1031 exchange, divorce, estate, relocation)? That informs how much negotiation room exists.
- Schools are A-rated — typically a magnet for longer-tenancy family renters. What's the average tenant stay here, and is there a school-zone premium baked into asking?
- What's the average days-on-market for RENTAL listings here right now (not sales)? A rising rental-DOM trend means longer vacancies and softer asking-rent achievability than the comps imply.
- What's the recent tenant-quality profile in this submarket — average credit score on applications, eviction rate, late-payment / NSF rate, and stable-employment percentage? A property-management company in the area should have these aggregated.
- How much new for-sale + rental construction is in the pipeline within 1–3 miles? Heavy new supply typically softens prices + rents 12–24 months out; constrained supply supports both.
CashFlowRE · CFR-HHAX426YJC7M61
· Data 1 day ago
cashflowre.app · 2026-05-29