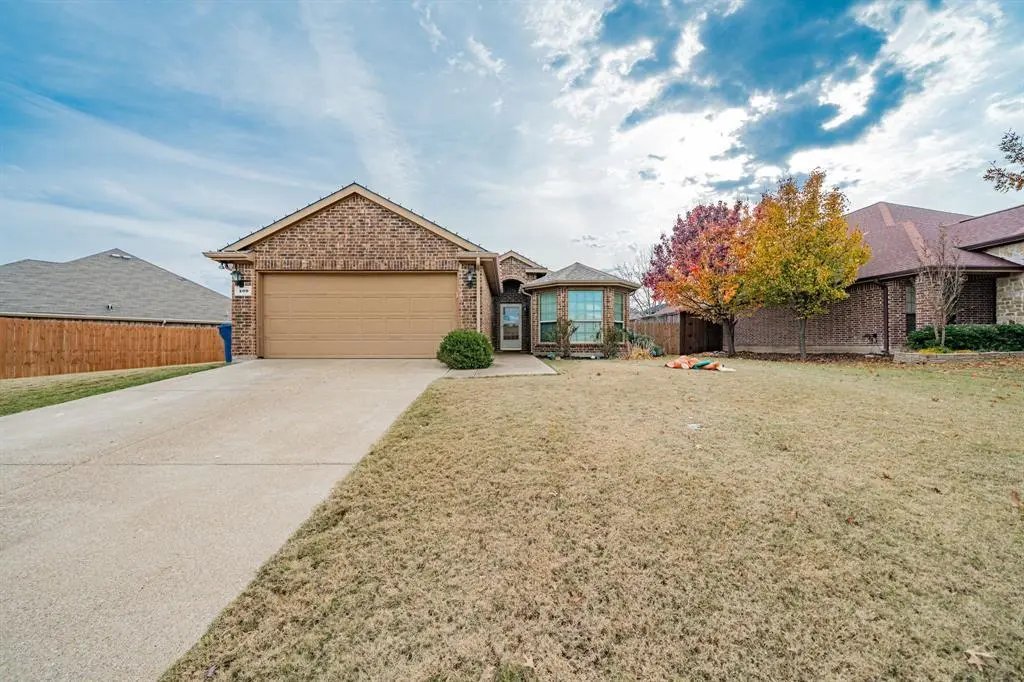
409 Jasmine Cir
Josephine, TX 75173
$255,000D
3 bd · 4.0 ba ·
1,617 sqft ·
Built 2012
· SingleFamily
· Active
· 32 DOM
Cashflow @ list (25.0% down · 7.5%)
Estimated rent
$2,063/mo
Mortgage (P&I)
−$1,337
Tax + insurance
−$538
HOA
−$30
Vac / Maint / Mgmt
−$433
Net cashflow
$-275/mo
Annual
$-3,301/yr
Cap rate
5.00%
Cash-on-cash
-4.62%
DSCR
0.79
1% rule
0.81%
Cash to close
$71,400
Investor read
- This is a 3-bed/4.0-bath single-family listed at $255k.
- At list price, monthly cash flow is $-275 ($-3k/yr) — negative.
- To cash-flow at today's rent, offer at most $206k (19.1% below list).
- To meet the 1% rule (rent ≥ 1% of price), the offer needs to be $206k (19.1% below list).
- It's been on market 32 days — a 3% lower offer ($247k) is reasonable based on typical stale-listing flexibility.
- Recommended offer: $206k (19.1% below list) — sets the bar for 1% rule.
- In year one you build about $27k of equity ($2k loan paydown + $26k appreciation (10.0% local appreciation)).
- Location reads 60/100 on livability (#1,076 in TX) — a middle-class / working-renter tenant base. Strengths: cost of living A+, housing A+, crime A-; Watch: amenities F, commute F, health & safety F.
- Community ISD (rural): math 30% / reading 38% proficiency, ranked #479 of 826 in TX (top 58%) — families likely to look elsewhere, expect single-tenant / working-renter base with shorter leases.
- Zoned schools: Leland E Edge Middle (math 25% / reading 35%, grade F, #1,056 of 1,662 statewide, top 65%, 931 students, 53% FRL) — zoned schools average 53% FRL vs 36% district-wide (18 pts higher); higher-poverty schools than district average — tighter screening recommended.
- Market conditions: 420 active listings in the ZIP; 27 comparable units currently listed for rent nearby; rentals at typical pace (median 15d on market — plan ~3-4 weeks tenant-placement turnaround); 19,194 units permitted in Collin County in 2024 (3,988 in 5+ unit buildings).
- Collin County population projected at +60% by 2050 — long-run rental-demand tailwind backs the buy-and-hold thesis.
- 5 sale attempts since 14y ago with the ask held roughly flat each time — persistent listings suggest the price (not the market) is what's stuck; bring a comps-based counter.
- By year 2, paydown + projected appreciation supports a ~$44k cash-out refi (75% LTV) — recoverable capital for the next deal without selling this one.
- Climate carrying-cost: major wind risk, 27% chance of damaging wind over 30y; major wildfire risk; extreme-heat days projected 7→23/yr by 2055 (HVAC capex compounding) — expect insurance premiums to compound above CPI over the hold.
Questions for listing agent
- What do current leases actually rent for vs. the listed asking? Can we see a recent rent roll and the last 12 months of T-12 income?
- It's been on market 32 days. Have you received any prior offers? Is the seller open to a 19% concession, seller financing, or rate buy-down credit?
- What does the HOA fee cover, when was the last increase, and are there any pending special assessments or reserve-fund shortfalls?
- Is there a deadline driving the sale (1031 exchange, divorce, estate, relocation)? That informs how much negotiation room exists.
- Schools are F-rated, which usually means shorter tenancies and higher turnover. Who's the typical renter profile here, and what's been the actual vacancy rate?
- The area grade is low — what's the realistic commute time and amenity access for the typical tenant pool here? Any planned neighborhood developments (good or bad) we should know about?
- What's the average days-on-market for RENTAL listings here right now (not sales)? A rising rental-DOM trend means longer vacancies and softer asking-rent achievability than the comps imply.
- What's the recent tenant-quality profile in this submarket — average credit score on applications, eviction rate, late-payment / NSF rate, and stable-employment percentage? A property-management company in the area should have these aggregated.
CashFlowRE · CFR-HJGEBZA3MQ7XW5
· Data 1 h ago
cashflowre.app · 2026-05-29