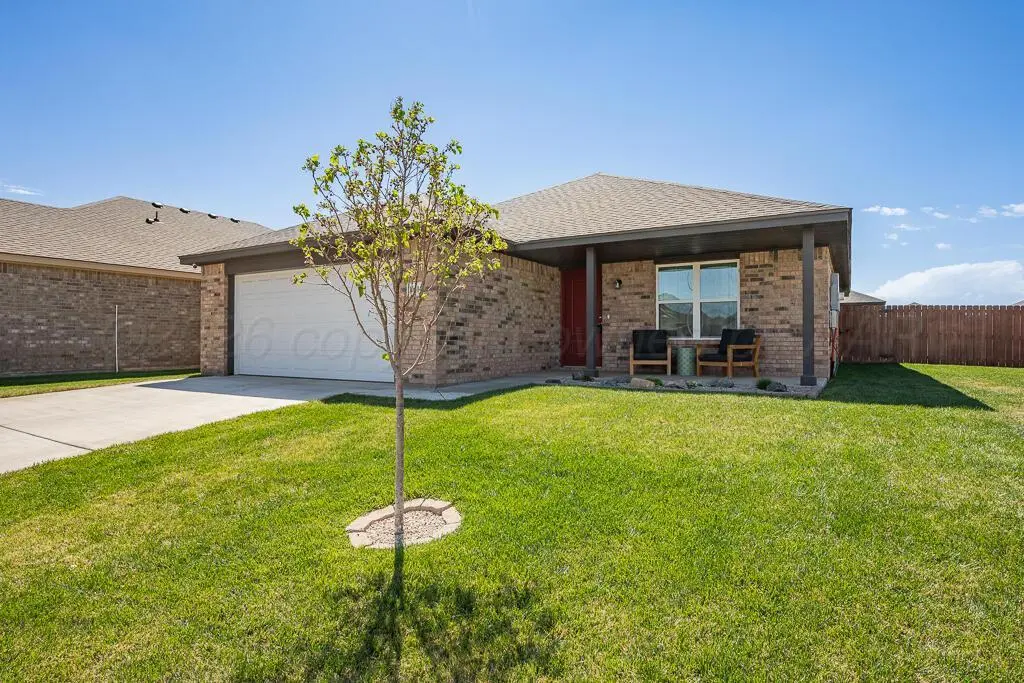
10404 Admire St
Amarillo, TX 79118
$229,900C-
3 bd · 2.0 ba ·
1,408 sqft ·
Built 2024
· SingleFamily
· Pending
· 4 DOM
Cashflow @ list (25.0% down · 7.5%)
Estimated rent
$2,270/mo
Mortgage (P&I)
−$1,206
Tax + insurance
−$367
HOA
−$3
Vac / Maint / Mgmt
−$477
Net cashflow
$217/mo
Annual
$2,604/yr
Cap rate
7.43%
Cash-on-cash
4.05%
DSCR
1.18
1% rule
0.99%
Cash to close
$64,372
Investor read
- This is a 3-bed/2.0-bath single-family listed at $230k. Condition is rated excellent.
- At list price, monthly cash flow is $217 ($3k/yr) — positive.
- The deal already cash-flows at list — no discount required.
- To meet the 1% rule (rent ≥ 1% of price), the offer needs to be $227k (1.3% below list).
- Only 4 days on market — expect competitive offers; lowballing is unlikely to land.
- Recommended offer: $227k (1.3% below list) — sets the bar for 1% rule.
- Local home prices are declining (-3.0%/yr); year-one equity from $2k of loan paydown is wiped out by about $7k of value loss. Plan a longer hold.
- Location reads 66/100 on livability (#624 in TX) — a middle-class / working-renter tenant base. Strengths: cost of living A+, housing A+; Watch: amenities C-, crime F, commute F.
- Canyon ISD (town): math 60% / reading 54% proficiency, ranked #78 of 826 in TX (top 9%) — acceptable for families but not a draw, mixed tenant base, ~2y average lease.
- Zoned schools: Sundown Lane El (math 52% / reading 47%, grade D, #865 of 4,322 statewide, top 21%, 341 students, 52% FRL); Greenways Int (math 73% / reading 50%, grade B+, #141 of 1,662 statewide, top 9%, 619 students, 35% FRL); Randall H S (math 43% / reading 64%, grade C-, #428 of 1,632 statewide, top 27%, 1,148 students, 35% FRL).
- Market conditions: Rents rising fast (+5.5%/yr); 278 active listings in the ZIP; 2 comparable units currently listed for rent nearby; solid renter incomes; 45 units permitted in Randall County in 2024 (0 in 5+ unit buildings).
- Randall County population projected at +36% by 2050 — long-run rental-demand tailwind backs the buy-and-hold thesis.
- 3 sale attempts since 2y ago with the ask held roughly flat each time — persistent listings suggest the price (not the market) is what's stuck; bring a comps-based counter.
- This rent runs 31% of the median local income ($88k/yr) — at the standard rent-burdened threshold; future hikes will face affordability resistance.
Questions for listing agent
- What does the HOA fee cover, when was the last increase, and are there any pending special assessments or reserve-fund shortfalls?
- Is there a deadline driving the sale (1031 exchange, divorce, estate, relocation)? That informs how much negotiation room exists.
- Schools are D-rated, which usually means shorter tenancies and higher turnover. Who's the typical renter profile here, and what's been the actual vacancy rate?
- Crime grade is F in this area — have there been break-ins, vandalism, or insurance claims at this property in the last 3 years? What carrier currently insures it and at what premium?
- What's the average days-on-market for RENTAL listings here right now (not sales)? A rising rental-DOM trend means longer vacancies and softer asking-rent achievability than the comps imply.
- What's the recent tenant-quality profile in this submarket — average credit score on applications, eviction rate, late-payment / NSF rate, and stable-employment percentage? A property-management company in the area should have these aggregated.
- How much new for-sale + rental construction is in the pipeline within 1–3 miles? Heavy new supply typically softens prices + rents 12–24 months out; constrained supply supports both.
CashFlowRE · CFR-HK6VFFBQ6YQXRA
· Data 4 weeks ago
cashflowre.app · 2026-05-29