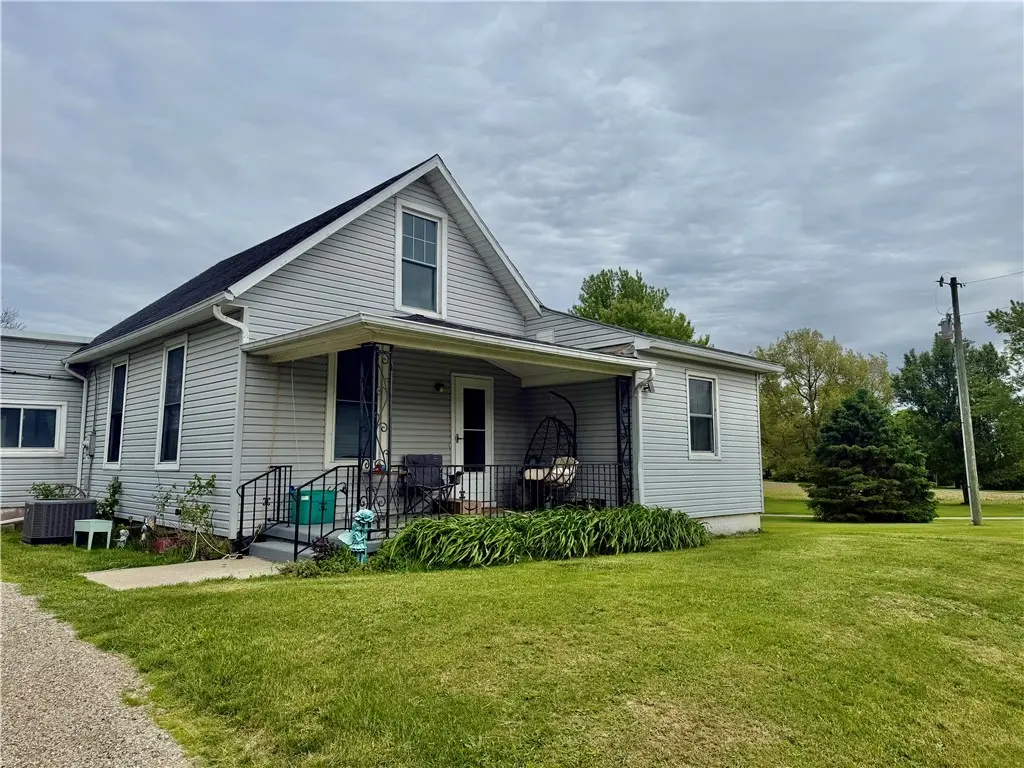
3032 W State Route 29
Urbana, OH 43078
$199,900D+
2 bd · 1.0 ba ·
1,707 sqft ·
Built 1900
· SingleFamily
· Pending
· 3 DOM
Cashflow @ list (25.0% down · 7.5%)
Estimated rent
$1,132/mo
Mortgage (P&I)
−$1,048
Tax + insurance
−$190
HOA
−$0
Vac / Maint / Mgmt
−$238
Net cashflow
$-344/mo
Annual
$-4,129/yr
Cap rate
4.23%
Cash-on-cash
-7.38%
DSCR
0.67
1% rule
0.57%
Cash to close
$55,972
Investor read
- This is a 2-bed/1.0-bath single-family listed at $200k.
- At list price, monthly cash flow is $-344 ($-4k/yr) — negative.
- To cash-flow at today's rent, offer at most $139k (30.4% below list).
- To meet the 1% rule (rent ≥ 1% of price), the offer needs to be $113k (43.4% below list).
- Only 3 days on market — expect competitive offers; lowballing is unlikely to land.
- Recommended offer: $113k (43.4% below list) — sets the bar for 1% rule.
- In year one you build about $21k of equity ($1k loan paydown + $20k appreciation (10.0% local appreciation)).
- Location reads 71/100 on livability (#404 in OH) — a middle-class / working-renter tenant base. Strengths: cost of living A+, housing A+, crime A-; Watch: amenities F, commute F, employment D-.
- Graham Local (rural): math 44% / reading 60% proficiency, ranked #407 of 656 in OH (top 62%) — acceptable for families but not a draw, mixed tenant base, ~2y average lease.
- Zoned schools: Graham Elementary School (math 50% / reading 61%, grade C, #772 of 1,584 statewide, top 49%, 725 students, 38% FRL); Graham Middle School (math 47% / reading 58%, grade C+, #378 of 654 statewide, top 59%, 389 students, 38% FRL); Graham High School (math 22% / reading 62%, grade F, #497 of 781 statewide, top 66%, 551 students, 30% FRL) — zoned schools at 35% FRL track the district average.
- Watch-outs: built in 1900 — expect roof / HVAC / electrical / plumbing capex.
- Market conditions: 91 active listings in the ZIP; 42 units permitted in Champaign County in 2024 (0 in 5+ unit buildings).
- Champaign County population projected at -25% by 2050 — secular population decline; favor cash flow + early exit over multi-decade hold.
- 2 sale attempts since 11y ago with the ask held roughly flat each time — persistent listings suggest the price (not the market) is what's stuck; bring a comps-based counter.
- Current owner paid $70k; list at $200k implies a 186% gain — meaningful room to come down on a strong offer.
- By year 2, paydown + projected appreciation supports a ~$34k cash-out refi (75% LTV) — recoverable capital for the next deal without selling this one.
- Cap rate 4.2% vs local median 3.3% in Urbana — meaningfully above typical; check what's discounted (condition, days-on-market, listing class) to confirm the premium yield is real.
Questions for listing agent
- What do current leases actually rent for vs. the listed asking? Can we see a recent rent roll and the last 12 months of T-12 income?
- Built in 1900 — when were the roof, HVAC, electrical panel, plumbing, and water heater last replaced?
- Is there a deadline driving the sale (1031 exchange, divorce, estate, relocation)? That informs how much negotiation room exists.
- The area grade is low — what's the realistic commute time and amenity access for the typical tenant pool here? Any planned neighborhood developments (good or bad) we should know about?
- What's the average days-on-market for RENTAL listings here right now (not sales)? A rising rental-DOM trend means longer vacancies and softer asking-rent achievability than the comps imply.
- What's the recent tenant-quality profile in this submarket — average credit score on applications, eviction rate, late-payment / NSF rate, and stable-employment percentage? A property-management company in the area should have these aggregated.
- How much new for-sale + rental construction is in the pipeline within 1–3 miles? Heavy new supply typically softens prices + rents 12–24 months out; constrained supply supports both.
CashFlowRE · CFR-HKGPXA226XJWKV
· Data 4 weeks ago
cashflowre.app · 2026-05-29