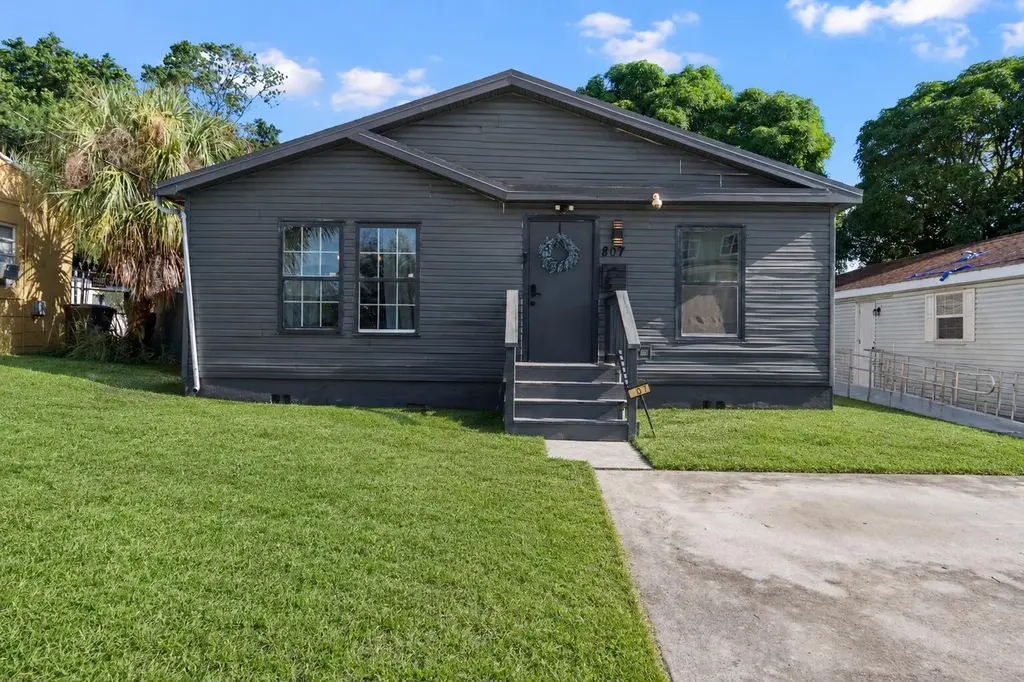
807 Grant St
West Palm Beach, FL 33407
$399,900C
3 bd · 2.0 ba ·
1,560 sqft ·
Built 2002
· SingleFamily
· Active
· 21 DOM
Cashflow @ list (25.0% down · 7.5%)
Estimated rent
$3,905/mo
Mortgage (P&I)
−$2,097
Tax + insurance
−$634
HOA
−$0
Vac / Maint / Mgmt
−$820
Net cashflow
$354/mo
Annual
$4,244/yr
Cap rate
7.35%
Cash-on-cash
3.79%
DSCR
1.17
1% rule
0.98%
Cash to close
$111,972
Investor read
- This is a 3-bed/2.0-bath single-family listed at $400k.
- At list price, monthly cash flow is $354 ($4k/yr) — positive.
- The deal already cash-flows at list — no discount required.
- To meet the 1% rule (rent ≥ 1% of price), the offer needs to be $390k (2.4% below list).
- It's been on market 21 days — a 2% lower offer ($394k) is reasonable based on typical stale-listing flexibility.
- Recommended offer: $390k (2.4% below list) — sets the bar for 1% rule.
- Local home prices are declining (-3.0%/yr); year-one equity from $3k of loan paydown is wiped out by about $12k of value loss. Plan a longer hold.
- Location reads 82/100 on livability (#75 in FL, #1,255 nationally) — a professional / high-income tenant draw. Strengths: commute A+, housing A+, health & safety A+; Watch: employment C-, crime F.
- Palm Beach (suburban): math 46% / reading 53% proficiency, ranked #34 of 73 in FL (top 47%) — families likely to look elsewhere, expect single-tenant / working-renter base with shorter leases.
- Zoned schools: Pleasant City Elementary School (math 27% / reading 27%, grade F, #1,969 of 2,144 statewide, top 94%, 330 students, 94% FRL); Palm Beach Lakes High School (math 17% / reading 26%, grade F, #546 of 667 statewide, top 82%, 2,688 students, 70% FRL) — zoned schools average 82% FRL vs 52% district-wide (30 pts higher); higher-poverty schools than district average — tighter screening recommended.
- Zoned-school proficiency averages 24% at this address vs 50% district-wide (-25 pts) — the specific schools serving this property underperform the Palm Beach average; the district grade overstates school quality for this exact location.
- Market conditions: Rents rising (+3.1%/yr); 305 active listings in the ZIP; 40 comparable units currently listed for rent nearby; rentals at typical pace (median 25d on market — plan ~3-4 weeks tenant-placement turnaround); 3,974 units permitted in Palm Beach County in 2024 (1,012 in 5+ unit buildings).
- Palm Beach County population projected at +30% by 2050 — long-run rental-demand tailwind backs the buy-and-hold thesis.
- 11 sale attempts since 27y ago with the ask held roughly flat each time — persistent listings suggest the price (not the market) is what's stuck; bring a comps-based counter.
- Current owner paid $220k; list at $400k implies a 82% gain — meaningful room to come down on a strong offer.
- Climate carrying-cost: severe wind risk, 99% chance of damaging wind over 30y; extreme-heat days projected 7→25/yr by 2055 (HVAC capex compounding) — expect insurance premiums to compound above CPI over the hold.
- Cap rate 7.4% vs local median 3.8% in West Palm Beach — top-decile yield for the area; either an underpriced asset or a hidden risk that comps aren't pricing in. Stress-test before assuming the spread holds.
- At $3,905/mo this rent would consume 78% of the median local household income ($60k/yr) (locally 2157% of renters already pay >50% of income on rent) — very limited rent-growth headroom before tenants either downsize or default.
Questions for listing agent
- Is there a deadline driving the sale (1031 exchange, divorce, estate, relocation)? That informs how much negotiation room exists.
- Crime grade is F in this area — have there been break-ins, vandalism, or insurance claims at this property in the last 3 years? What carrier currently insures it and at what premium?
- What's the average days-on-market for RENTAL listings here right now (not sales)? A rising rental-DOM trend means longer vacancies and softer asking-rent achievability than the comps imply.
- What's the recent tenant-quality profile in this submarket — average credit score on applications, eviction rate, late-payment / NSF rate, and stable-employment percentage? A property-management company in the area should have these aggregated.
- How much new for-sale + rental construction is in the pipeline within 1–3 miles? Heavy new supply typically softens prices + rents 12–24 months out; constrained supply supports both.
CashFlowRE · CFR-HKVRACD6DDFNHK
· Data 2 days ago
cashflowre.app · 2026-05-29