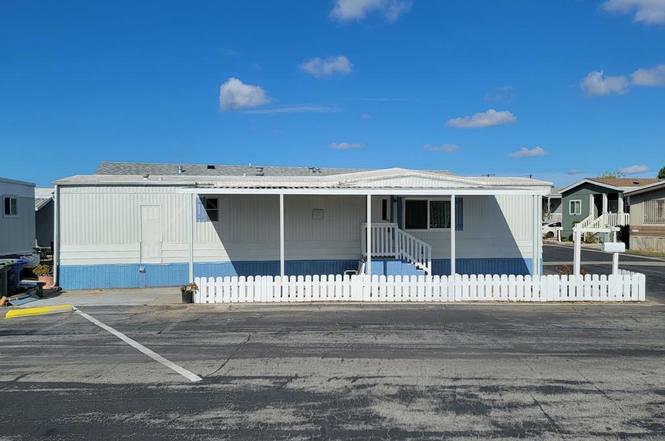
2178 Thrush Ave Unit J
Oxnard, CA 93033
$131,000B
1 bd · 1.0 ba ·
576 sqft ·
Built 1976
· Manufactured
· Active
· 138 DOM
Cashflow @ list (25.0% down · 7.5%)
Estimated rent
$2,012/mo
Mortgage (P&I)
−$687
Tax + insurance
−$218
HOA
−$0
Vac / Maint / Mgmt
−$422
Net cashflow
$684/mo
Annual
$8,209/yr
Cap rate
12.56%
Cash-on-cash
22.38%
DSCR
2.00
1% rule
1.54%
Cash to close
$36,680
Investor read
- This is a 1-bed/1.0-bath manufactured listed at $131k. Condition is rated good.
- At list price, monthly cash flow is $684 ($8k/yr) — positive.
- The deal already cash-flows at list — no discount required.
- Meets the 1% rule at list price ($2k rent vs $131k).
- It's been on market 138 days — a 12% lower offer ($115k) is reasonable based on typical stale-listing flexibility.
- Recommended offer: $115k (12.0% below list) — sets the bar for market timing.
- Local home prices are declining (-3.0%/yr); year-one equity from $906 of loan paydown is wiped out by about $4k of value loss. Plan a longer hold.
- Location reads 54/100 on livability (#905 in CA) — a working-class tenant base; expect higher turnover. Strengths: employment A-, health & safety A-, housing B; Watch: crime F, amenities D-, commute F.
- Oxnard Union High (urban): math 28% / reading 51% proficiency, ranked #220 of 517 in CA (top 43%) — families likely to look elsewhere, expect single-tenant / working-renter base with shorter leases.
- Zoned schools: Mar Vista Elementary (471 students, 80% FRL); Ocean View Junior High (775 students, 70% FRL); Channel Islands High (math 25% / reading 51%, grade F, #571 of 1,170 statewide, top 49%, 2,643 students, 79% FRL).
- Market conditions: Rents flat; 31 active listings in the ZIP; 1 comparable units currently listed for rent nearby; solid renter incomes; 1,759 units permitted in Ventura County in 2024 (1,196 in 5+ unit buildings).
- Ventura County population projected at +4% by 2050 — modest demand growth; plan on rents tracking national, not racing it.
- 2 sale attempts with the ask held roughly flat each time — persistent listings suggest the price (not the market) is what's stuck; bring a comps-based counter.
- At projected returns (-3.0% appreciation + 0.0% rent growth), your $37k cash investment doubles in ~7 years — after that, you're playing with house money.
- Cap rate 12.6% vs local median 2.5% in Oxnard — top-decile yield for the area; either an underpriced asset or a hidden risk that comps aren't pricing in. Stress-test before assuming the spread holds.
Questions for listing agent
- It's been on market 138 days. Have you received any prior offers? Is the seller open to a 12% concession, seller financing, or rate buy-down credit?
- Built in 1976 — when were the roof, HVAC, electrical panel, plumbing, and water heater last replaced?
- Why hasn't it sold? Are there any deal-killer items the seller is aware of (foundation, flood, title, zoning, code violations)?
- Is there a deadline driving the sale (1031 exchange, divorce, estate, relocation)? That informs how much negotiation room exists.
- Schools are F-rated, which usually means shorter tenancies and higher turnover. Who's the typical renter profile here, and what's been the actual vacancy rate?
- Crime grade is F in this area — have there been break-ins, vandalism, or insurance claims at this property in the last 3 years? What carrier currently insures it and at what premium?
- What's the average days-on-market for RENTAL listings here right now (not sales)? A rising rental-DOM trend means longer vacancies and softer asking-rent achievability than the comps imply.
- What's the recent tenant-quality profile in this submarket — average credit score on applications, eviction rate, late-payment / NSF rate, and stable-employment percentage? A property-management company in the area should have these aggregated.
CashFlowRE · CFR-HKXTF70NBQTHF0
· Data 17 h ago
cashflowre.app · 2026-05-29