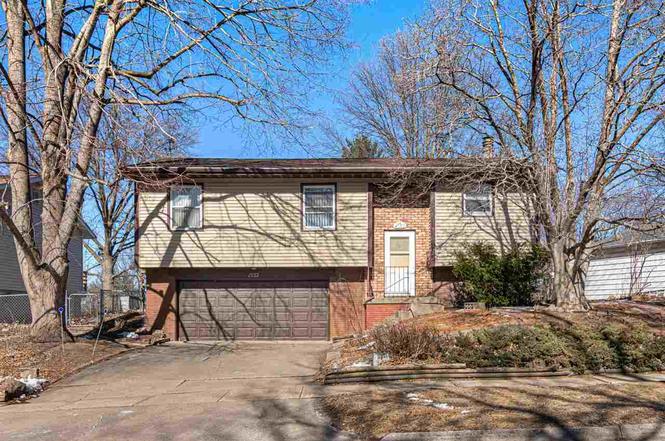
1532 Tracy Ln
Iowa City, IA 52240
$194,900D+
3 bd · 2.0 ba ·
1,026 sqft ·
Built 1977
· SingleFamily
· Pending
· 2 DOM
Cashflow @ list (25.0% down · 7.5%)
Estimated rent
$1,570/mo
Mortgage (P&I)
−$1,022
Tax + insurance
−$339
HOA
−$0
Vac / Maint / Mgmt
−$330
Net cashflow
$-120/mo
Annual
$-1,440/yr
Cap rate
5.55%
Cash-on-cash
-2.64%
DSCR
0.88
1% rule
0.81%
Cash to close
$54,572
Investor read
- This is a 3-bed/2.0-bath single-family listed at $195k.
- At list price, monthly cash flow is $-120 ($-1k/yr) — negative.
- To cash-flow at today's rent, offer at most $174k (10.9% below list).
- To meet the 1% rule (rent ≥ 1% of price), the offer needs to be $157k (19.4% below list).
- Only 2 days on market — expect competitive offers; lowballing is unlikely to land.
- Recommended offer: $157k (19.4% below list) — sets the bar for 1% rule.
- Local home prices are declining (-3.0%/yr); year-one equity from $1k of loan paydown is wiped out by about $6k of value loss. Plan a longer hold.
- Location reads 86/100 on livability (#13 in IA, #450 nationally) — a professional / high-income tenant draw. Strengths: amenities A+, commute A+, cost of living A+.
- Iowa City Community School District (urban): math 65% / reading 70% proficiency, ranked #174 of 289 in IA (top 60%) — acceptable for families but not a draw, mixed tenant base, ~2y average lease.
- Zoned schools: Kirkwood Elementary School (math 27% / reading 37%, grade F, #601 of 616 statewide, top 98%, 269 students, 69% FRL); Southeast Junior High School (math 64% / reading 68%, grade A-, #152 of 246 statewide, top 62%, 812 students, 50% FRL); Iowa City High School (math 62% / reading 73%, grade B, #186 of 336 statewide, top 57%, 1,599 students, 40% FRL) — zoned schools average 53% FRL vs 30% district-wide (23 pts higher); higher-poverty schools than district average — tighter screening recommended.
- Zoned-school proficiency averages 55% at this address vs 68% district-wide (-12 pts) — the specific schools serving this property underperform the Iowa City Community School District average; the district grade overstates school quality for this exact location.
- Market conditions: Rents rising fast (+6.3%/yr); 260 active listings in the ZIP; 7 comparable units currently listed for rent nearby; rentals at typical pace (median 22d on market — plan ~3-4 weeks tenant-placement turnaround); 43% of comp listings sitting > 30 days — soft ceiling on asking rent; 714 units permitted in Johnson County in 2024 (158 in 5+ unit buildings).
- Johnson County population projected at +60% by 2050 — long-run rental-demand tailwind backs the buy-and-hold thesis.
- Current owner paid $140k; 39% above their basis — modest negotiation headroom, anchor on the comps not their cost.
- Cap rate 5.6% vs local median 2.7% in Iowa City — top-decile yield for the area; either an underpriced asset or a hidden risk that comps aren't pricing in. Stress-test before assuming the spread holds.
- This rent runs 36% of the median local income ($53k/yr) — at the standard rent-burdened threshold; future hikes will face affordability resistance.
Questions for listing agent
- What do current leases actually rent for vs. the listed asking? Can we see a recent rent roll and the last 12 months of T-12 income?
- Built in 1977 — when were the roof, HVAC, electrical panel, plumbing, and water heater last replaced?
- Is there a deadline driving the sale (1031 exchange, divorce, estate, relocation)? That informs how much negotiation room exists.
- Schools are A-rated — typically a magnet for longer-tenancy family renters. What's the average tenant stay here, and is there a school-zone premium baked into asking?
- The area grade is low — what's the realistic commute time and amenity access for the typical tenant pool here? Any planned neighborhood developments (good or bad) we should know about?
- What's the average days-on-market for RENTAL listings here right now (not sales)? A rising rental-DOM trend means longer vacancies and softer asking-rent achievability than the comps imply.
- What's the recent tenant-quality profile in this submarket — average credit score on applications, eviction rate, late-payment / NSF rate, and stable-employment percentage? A property-management company in the area should have these aggregated.
- How much new for-sale + rental construction is in the pipeline within 1–3 miles? Heavy new supply typically softens prices + rents 12–24 months out; constrained supply supports both.
CashFlowRE · CFR-HNWHNQ7906B1AJ
· Data 3 weeks ago
cashflowre.app · 2026-05-29