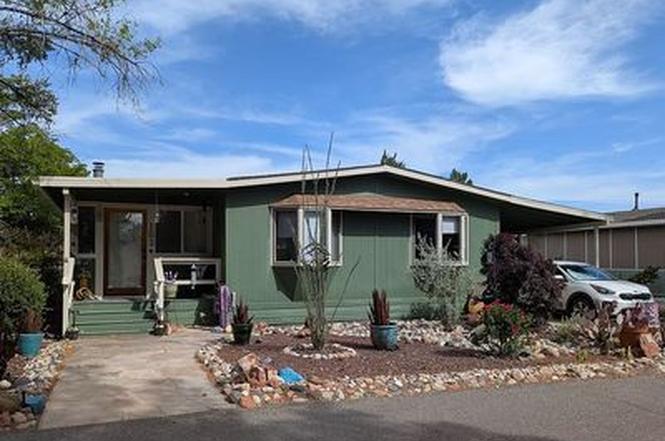
6770 W State Route 89a #41 --
Sedona, AZ 86336
$124,500B-
3 bd · 2.0 ba ·
1,440 sqft ·
Built 1989
· Land
· Active
· 311 DOM
Cashflow @ list (25.0% down · 7.5%)
Estimated rent
$2,811/mo
Mortgage (P&I)
−$653
Tax + insurance
−$208
HOA
−$0
Vac / Maint / Mgmt
−$590
Net cashflow
$1,360/mo
Annual
$16,321/yr
Cap rate
19.40%
Cash-on-cash
46.82%
DSCR
3.08
1% rule
2.26%
Cash to close
$34,860
Investor read
- This is a 3-bed/2.0-bath land listed at $124k.
- At list price, monthly cash flow is $1k ($16k/yr) — positive.
- The deal already cash-flows at list — no discount required.
- Meets the 1% rule at list price ($3k rent vs $124k).
- It's been on market 311 days — a 12% lower offer ($110k) is reasonable based on typical stale-listing flexibility.
- Recommended offer: $110k (12.0% below list) — sets the bar for market timing.
- Local home prices are declining (-3.0%/yr); year-one equity from $861 of loan paydown is wiped out by about $4k of value loss. Plan a longer hold.
- Location reads 68/100 on livability (#55 in AZ) — a middle-class / working-renter tenant base. Strengths: commute A+, amenities B+; Watch: cost of living F.
- Sedona-Oak Creek JUSD #9 (4467) (town): math 12% / reading 21% proficiency, ranked #197 of 249 in AZ (top 79%) — low school quality limits family demand, transient renter base, plan for 1-2y turnover.
- Zoned schools: West Sedona Elementary School (math 12% / reading 17%, grade F, #898 of 1,109 statewide, top 83%, 256 students, 62% FRL); Sedona Red Rock Junior/Senior High School (math 12% / reading 22%, grade F, #252 of 381 statewide, top 67%, 482 students, 45% FRL).
- Market conditions: Rents soft (-1.3%/yr); 313 active listings in the ZIP; 4 comparable units currently listed for rent nearby; rentals at typical pace (median 21d on market — plan ~3-4 weeks tenant-placement turnaround); 2,062 units permitted in Yavapai County in 2024 (98 in 5+ unit buildings).
- Yavapai County population projected at +10% by 2050 — modest demand growth; plan on rents tracking national, not racing it.
- 19 sale attempts since 22y ago; this cycle's ask has dropped $25k (17%) from the opening price — seller is motivated, your offer sets the floor, not the list.
- At projected returns (-3.0% appreciation + 0.0% rent growth), your $35k cash investment doubles in ~3 years — after that, you're playing with house money.
- Cap rate 19.4% vs local median 1.4% in Sedona — top-decile yield for the area; either an underpriced asset or a hidden risk that comps aren't pricing in. Stress-test before assuming the spread holds.
- At $2,811/mo this rent would consume 49% of the median local household income ($68k/yr) (locally 239% of renters already pay >50% of income on rent) — very limited rent-growth headroom before tenants either downsize or default.
Questions for listing agent
- It's been on market 311 days. Have you received any prior offers? Is the seller open to a 12% concession, seller financing, or rate buy-down credit?
- Why hasn't it sold? Are there any deal-killer items the seller is aware of (foundation, flood, title, zoning, code violations)?
- Is there a deadline driving the sale (1031 exchange, divorce, estate, relocation)? That informs how much negotiation room exists.
- What's the average days-on-market for RENTAL listings here right now (not sales)? A rising rental-DOM trend means longer vacancies and softer asking-rent achievability than the comps imply.
- What's the recent tenant-quality profile in this submarket — average credit score on applications, eviction rate, late-payment / NSF rate, and stable-employment percentage? A property-management company in the area should have these aggregated.
- How much new for-sale + rental construction is in the pipeline within 1–3 miles? Heavy new supply typically softens prices + rents 12–24 months out; constrained supply supports both.
CashFlowRE · CFR-HVNXC9C97GREXC
· Data 2 days ago
cashflowre.app · 2026-05-29