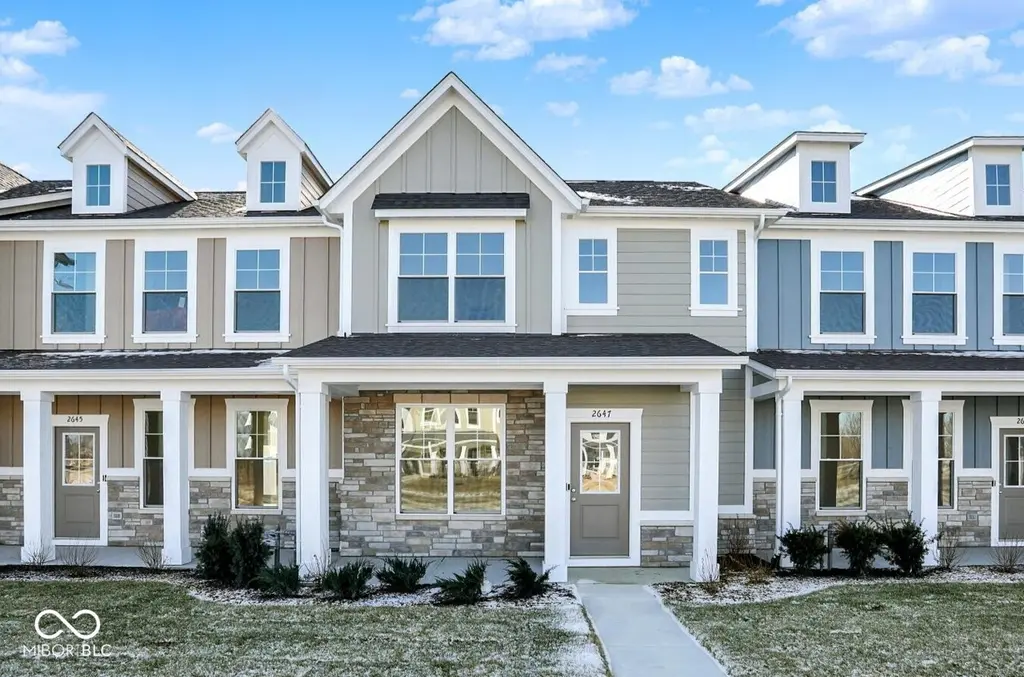
2647 Marjorie Ln
Plainfield, IN 46168
$281,770D
3 bd · 2.0 ba ·
1,415 sqft ·
Built 2025
· Townhouse
· Active
· 142 DOM
Cashflow @ list (25.0% down · 7.5%)
Estimated rent
$2,445/mo
Mortgage (P&I)
−$1,478
Tax + insurance
−$470
HOA
−$145
Vac / Maint / Mgmt
−$513
Net cashflow
$-161/mo
Annual
$-1,929/yr
Cap rate
5.61%
Cash-on-cash
-2.44%
DSCR
0.89
1% rule
0.87%
Cash to close
$78,896
Investor read
- This is a 3-bed/2.0-bath townhouse listed at $282k. Condition is rated good.
- At list price, monthly cash flow is $-161 ($-2k/yr) — negative.
- To cash-flow at today's rent, offer at most $259k (8.3% below list).
- To meet the 1% rule (rent ≥ 1% of price), the offer needs to be $244k (13.2% below list).
- It's been on market 142 days — a 12% lower offer ($248k) is reasonable based on typical stale-listing flexibility.
- Recommended offer: $244k (13.2% below list) — sets the bar for 1% rule.
- Local home prices are declining (-3.0%/yr); year-one equity from $2k of loan paydown is wiped out by about $8k of value loss. Plan a longer hold.
- Location reads 74/100 on livability (#69 in IN, #4,418 nationally) — a middle-class / working-renter tenant base. Strengths: cost of living A+, housing A+, schools A; Watch: health & safety C-, amenities F, commute F.
- Avon Community School Corporation (suburban): math 51% / reading 53% proficiency, ranked #32 of 301 in IN (top 11%) — acceptable for families but not a draw, mixed tenant base, ~2y average lease; only 20% free/reduced lunch — higher-income household profile.
- Market conditions: Rents rising (+3.6%/yr); 284 active listings in the ZIP; 14 comparable units currently listed for rent nearby; rentals leasing fast (median 2d on market — plan ~1-2 weeks tenant-placement turnaround); solid renter incomes; 1,294 units permitted in Hendricks County in 2024 (18 in 5+ unit buildings).
- Hendricks County population projected at +35% by 2050 — long-run rental-demand tailwind backs the buy-and-hold thesis.
- 2 sale attempts with the ask held roughly flat each time — persistent listings suggest the price (not the market) is what's stuck; bring a comps-based counter.
- Cap rate 5.6% vs local median 3.7% in Plainfield — top-decile yield for the area; either an underpriced asset or a hidden risk that comps aren't pricing in. Stress-test before assuming the spread holds.
- This rent runs 33% of the median local income ($90k/yr) — at the standard rent-burdened threshold; future hikes will face affordability resistance.
Questions for listing agent
- What do current leases actually rent for vs. the listed asking? Can we see a recent rent roll and the last 12 months of T-12 income?
- It's been on market 142 days. Have you received any prior offers? Is the seller open to a 13% concession, seller financing, or rate buy-down credit?
- What does the HOA fee cover, when was the last increase, and are there any pending special assessments or reserve-fund shortfalls?
- Why hasn't it sold? Are there any deal-killer items the seller is aware of (foundation, flood, title, zoning, code violations)?
- Is there a deadline driving the sale (1031 exchange, divorce, estate, relocation)? That informs how much negotiation room exists.
- Schools are A-rated — typically a magnet for longer-tenancy family renters. What's the average tenant stay here, and is there a school-zone premium baked into asking?
- The area grade is low — what's the realistic commute time and amenity access for the typical tenant pool here? Any planned neighborhood developments (good or bad) we should know about?
- What's the average days-on-market for RENTAL listings here right now (not sales)? A rising rental-DOM trend means longer vacancies and softer asking-rent achievability than the comps imply.
CashFlowRE · CFR-HWA1SWB2M9CWW1
· Data 2 days ago
cashflowre.app · 2026-05-29