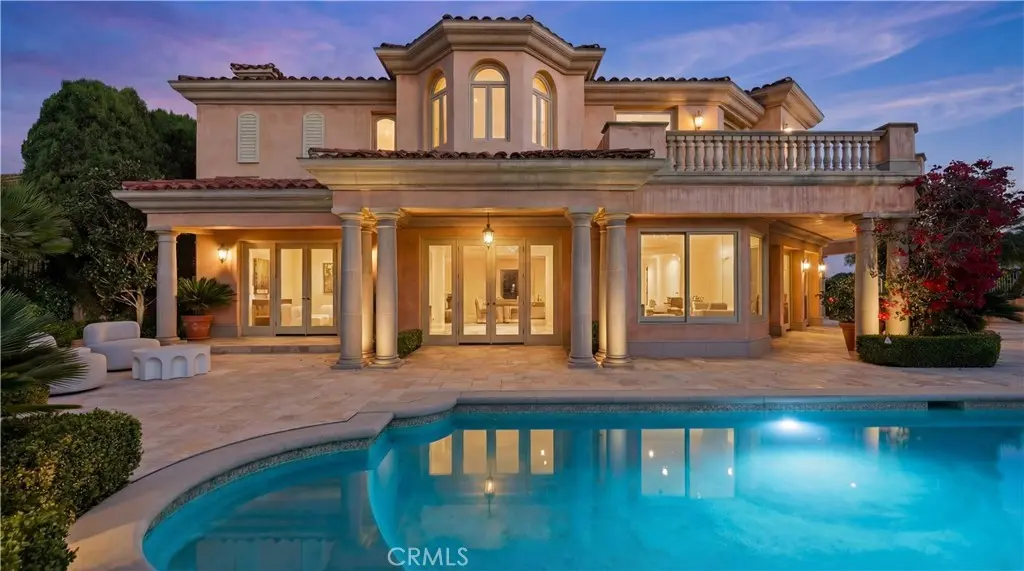
11 Shoreview
Newport Beach, CA 92657
$16,995,000D
6 bd · 8.0 ba ·
12,278 sqft ·
Built 1994
· SingleFamily
· Active
· 207 DOM
Cashflow @ list (25.0% down · 7.5%)
Estimated rent
$10,007/mo
Mortgage (P&I)
−$89,124
Tax + insurance
−$11,280
HOA
−$680
Vac / Maint / Mgmt
−$2,101
Net cashflow
$-93,178/mo
Annual
$-1,118,137/yr
Cap rate
-0.29%
Cash-on-cash
-23.50%
DSCR
-0.05
1% rule
0.06%
Cash to close
$4,758,600
Investor read
- This is a 6-bed/8.0-bath single-family listed at $17.00M.
- At list price, monthly cash flow is $-93k ($-1.12M/yr) — negative.
- To cash-flow at today's rent, offer at most $1.01M (94.1% below list).
- To meet the 1% rule (rent ≥ 1% of price), the offer needs to be $1.00M (94.1% below list).
- It's been on market 207 days — a 12% lower offer ($14.96M) is reasonable based on typical stale-listing flexibility.
- Recommended offer: $1.00M (94.1% below list) — sets the bar for 1% rule.
- In year one you build about $1.82M of equity ($117k loan paydown + $1.70M appreciation (10.0% local appreciation)).
- Location reads 76/100 on livability (#101 in CA, #3,645 nationally) — a middle-class / working-renter tenant base. Strengths: amenities A+, employment A+, commute A; Watch: health & safety C-, cost of living F.
- Newport-Mesa Unified (urban): math 46% / reading 58% proficiency, ranked #106 of 517 in CA (top 20%) — acceptable for families but not a draw, mixed tenant base, ~2y average lease.
- Zoned schools: Harbor View Elementary (math 67%, 295 students, 12% FRL); Corona Del Mar High (math 55% / reading 63%, grade C+, #221 of 1,170 statewide, top 19%, 2,059 students, 20% FRL) — zoned schools average 16% FRL vs 40% district-wide (24 pts lower); this property's tenant base skews higher-income than the district average.
- Market conditions: Rents rising fast (+6.6%/yr); 55 active listings in the ZIP; 2 comparable units currently listed for rent nearby; high-income renter base; 6,974 units permitted in Orange County in 2024 (3,839 in 5+ unit buildings).
- Orange County population projected at +14% by 2050 — modest demand growth; plan on rents tracking national, not racing it.
- By year 2, paydown + projected appreciation supports a ~$2.92M cash-out refi (75% LTV) — recoverable capital for the next deal without selling this one.
- Cap rate -0.3% vs local median 0.6% in Newport Beach — below-typical yield; the buyer is paying a premium for something (appreciation thesis, condition, location) that the cap rate doesn't capture.
- At $10,007/mo this rent would consume 65% of the median local household income ($185k/yr) (locally 297% of renters already pay >50% of income on rent) — very limited rent-growth headroom before tenants either downsize or default.
Questions for listing agent
- What do current leases actually rent for vs. the listed asking? Can we see a recent rent roll and the last 12 months of T-12 income?
- It's been on market 207 days. Have you received any prior offers? Is the seller open to a 94% concession, seller financing, or rate buy-down credit?
- What does the HOA fee cover, when was the last increase, and are there any pending special assessments or reserve-fund shortfalls?
- Why hasn't it sold? Are there any deal-killer items the seller is aware of (foundation, flood, title, zoning, code violations)?
- Is there a deadline driving the sale (1031 exchange, divorce, estate, relocation)? That informs how much negotiation room exists.
- Schools are A-rated — typically a magnet for longer-tenancy family renters. What's the average tenant stay here, and is there a school-zone premium baked into asking?
- The area grade is low — what's the realistic commute time and amenity access for the typical tenant pool here? Any planned neighborhood developments (good or bad) we should know about?
- What's the average days-on-market for RENTAL listings here right now (not sales)? A rising rental-DOM trend means longer vacancies and softer asking-rent achievability than the comps imply.
CashFlowRE · CFR-HXJHRQEW23N419
· Data 14 h ago
cashflowre.app · 2026-05-29