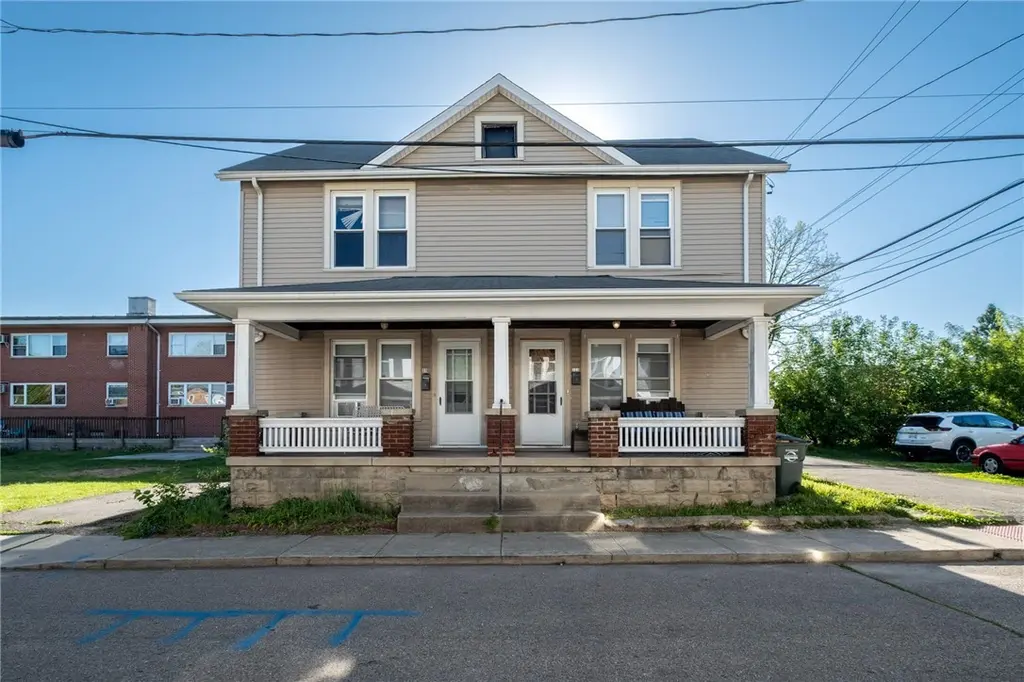
119 S Galloway St
Xenia, OH 45385
$170,000C+
4 bd · 2.0 ba ·
2,278 sqft ·
Built 1900
· MultiFamily
· Pending
· 1 DOM
Cashflow @ list (25.0% down · 7.5%)
Estimated rent
$2,213/mo
Mortgage (P&I)
−$891
Tax + insurance
−$219
HOA
−$0
Vac / Maint / Mgmt
−$465
Net cashflow
$638/mo
Annual
$7,658/yr
Cap rate
10.80%
Cash-on-cash
16.09%
DSCR
1.72
1% rule
1.30%
Cash to close
$47,600
Investor read
- This is a 2 × 2-bed/1.0-bath units multifamily listed at $170k.
- At list price, monthly cash flow is $638 ($8k/yr) — positive. Per door: $319/mo.
- The deal already cash-flows at list — no discount required.
- Meets the 1% rule at list price ($2k rent vs $170k).
- Only 1 days on market — expect competitive offers; lowballing is unlikely to land.
- Local home prices are declining (-3.0%/yr); year-one equity from $1k of loan paydown is wiped out by about $5k of value loss. Plan a longer hold.
- Location reads 75/100 on livability (#244 in OH, #3,892 nationally) — a middle-class / working-renter tenant base. Strengths: cost of living A+, housing A+, health & safety B+; Watch: amenities D+, commute F, employment F.
- Xenia Community City (suburban): math 42% / reading 53% proficiency, ranked #478 of 656 in OH (top 73%) — families likely to look elsewhere, expect single-tenant / working-renter base with shorter leases.
- Watch-outs: built in 1900 — expect roof / HVAC / electrical / plumbing capex.
- Market conditions: Rents rising fast (+5.5%/yr); 234 active listings in the ZIP; 2 comparable units currently listed for rent nearby; solid renter incomes; 797 units permitted in Greene County in 2024 (148 in 5+ unit buildings).
- 3 sale attempts since 12y ago with the ask held roughly flat each time — persistent listings suggest the price (not the market) is what's stuck; bring a comps-based counter.
- Current owner paid $79k; list at $170k implies a 116% gain — meaningful room to come down on a strong offer.
- At projected returns (-3.0% appreciation + 5.5% rent growth), your $48k cash investment doubles in ~7 years — after that, you're playing with house money.
- Cap rate 10.8% vs local median 3.6% in Xenia — top-decile yield for the area; either an underpriced asset or a hidden risk that comps aren't pricing in. Stress-test before assuming the spread holds.
- This rent runs 35% of the median local income ($77k/yr) — at the standard rent-burdened threshold; future hikes will face affordability resistance.
Questions for listing agent
- Can we see the unit-by-unit rent roll, current vacancy, and any below-market leases? What's the average tenancy length?
- What capital expenditures (roof, boiler, parking lot, exteriors) have been made in the last 5 years, and what's planned in the next 2?
- Built in 1900 — when were the roof, HVAC, electrical panel, plumbing, and water heater last replaced?
- Is there a deadline driving the sale (1031 exchange, divorce, estate, relocation)? That informs how much negotiation room exists.
- What's the average days-on-market for RENTAL listings here right now (not sales)? A rising rental-DOM trend means longer vacancies and softer asking-rent achievability than the comps imply.
- What's the recent tenant-quality profile in this submarket — average credit score on applications, eviction rate, late-payment / NSF rate, and stable-employment percentage? A property-management company in the area should have these aggregated.
- How much new apartment / multifamily construction is in the pipeline within 1–3 miles? Heavy new supply (>2% of stock underway) typically softens rents 12–24 months out; light construction supports rent growth.
CashFlowRE · CFR-HXSJKG2RK19QJT
· Data 3 weeks ago
cashflowre.app · 2026-05-29