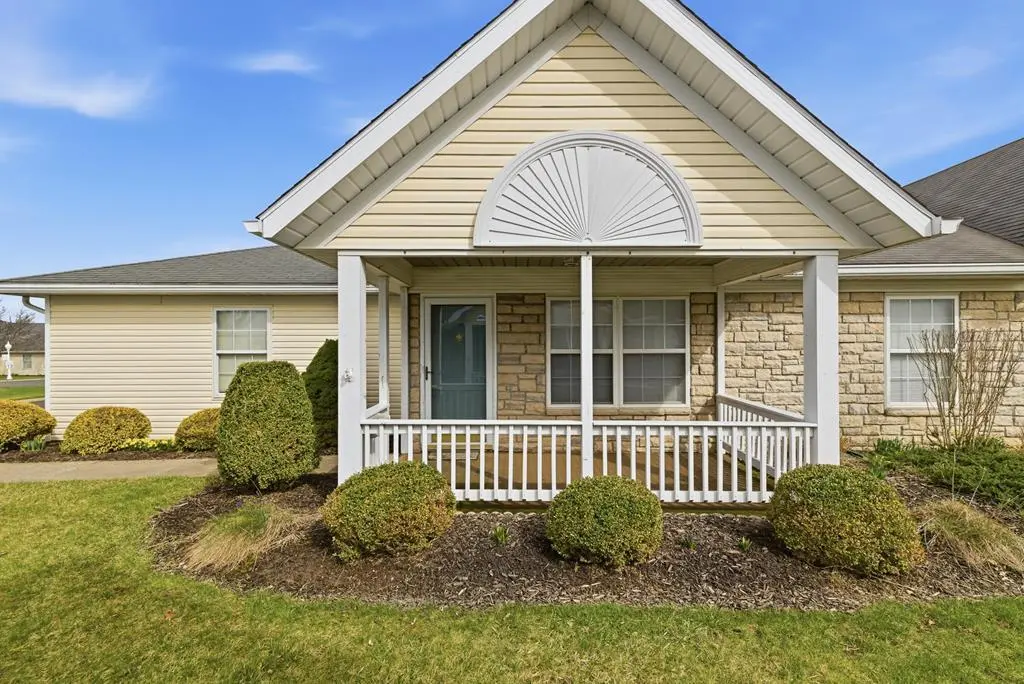
677 Villa Dr
Ontario, OH 44906
$184,900D
2 bd · 2.0 ba ·
1,132 sqft ·
Built 1999
· Condo
· Active
· 89 DOM
Cashflow @ list (25.0% down · 7.5%)
Estimated rent
$1,495/mo
Mortgage (P&I)
−$970
Tax + insurance
−$223
HOA
−$0
Vac / Maint / Mgmt
−$314
Net cashflow
$-12/mo
Annual
$-139/yr
Cap rate
6.22%
Cash-on-cash
-0.27%
DSCR
0.99
1% rule
0.81%
Cash to close
$51,772
Investor read
- This is a 2-bed/2.0-bath condo listed at $185k.
- At list price, monthly cash flow is $-12 ($-139/yr) — negative.
- To cash-flow at today's rent, offer at most $183k (1.1% below list).
- To meet the 1% rule (rent ≥ 1% of price), the offer needs to be $150k (19.1% below list).
- It's been on market 89 days — a 6% lower offer ($174k) is reasonable based on typical stale-listing flexibility.
- Recommended offer: $150k (19.1% below list) — sets the bar for 1% rule.
- Local home prices are declining (-3.0%/yr); year-one equity from $1k of loan paydown is wiped out by about $6k of value loss. Plan a longer hold.
- Location reads 66/100 on livability (#673 in OH) — a middle-class / working-renter tenant base. Strengths: cost of living A+, housing A+, health & safety B+; Watch: amenities F, commute F.
- Ontario Local (rural): math 66% / reading 71% proficiency, ranked #161 of 656 in OH (top 24%) — acceptable for families but not a draw, mixed tenant base, ~2y average lease; only 20% free/reduced lunch — higher-income household profile.
- Zoned schools: Stingel Elementary School (math 69% / reading 68%, grade B+, #434 of 1,584 statewide, top 28%, 937 students, 0% FRL); Ontario Middle School (math 68% / reading 71%, grade A, #143 of 654 statewide, top 23%, 468 students, 27% FRL); Ontario High School (math 52% / reading 77%, grade B-, #164 of 781 statewide, top 24%, 527 students, 24% FRL) — zoned schools at 17% FRL track the district average.
- Market conditions: 119 active listings in the ZIP; 1 comparable units currently listed for rent nearby; 145 units permitted in Richland County in 2024 (0 in 5+ unit buildings).
- Richland County population projected at -18% by 2050 — secular population decline; favor cash flow + early exit over multi-decade hold.
- Current owner paid $142k; 30% above their basis — modest negotiation headroom, anchor on the comps not their cost.
- Cap rate 6.2% vs local median 2.4% in Ontario — top-decile yield for the area; either an underpriced asset or a hidden risk that comps aren't pricing in. Stress-test before assuming the spread holds.
- This rent runs 35% of the median local income ($51k/yr) — at the standard rent-burdened threshold; future hikes will face affordability resistance.
Questions for listing agent
- What do current leases actually rent for vs. the listed asking? Can we see a recent rent roll and the last 12 months of T-12 income?
- It's been on market 89 days. Have you received any prior offers? Is the seller open to a 19% concession, seller financing, or rate buy-down credit?
- Any open or pending special assessments — roof, HVAC, plumbing, elevator, façade? What's the per-unit balance and payoff schedule, and is the seller paying it off at close or rolling it to the buyer?
- Why hasn't it sold? Are there any deal-killer items the seller is aware of (foundation, flood, title, zoning, code violations)?
- Is there a deadline driving the sale (1031 exchange, divorce, estate, relocation)? That informs how much negotiation room exists.
- Schools are B-rated — typically a magnet for longer-tenancy family renters. What's the average tenant stay here, and is there a school-zone premium baked into asking?
- The area grade is low — what's the realistic commute time and amenity access for the typical tenant pool here? Any planned neighborhood developments (good or bad) we should know about?
- What's the average days-on-market for RENTAL listings here right now (not sales)? A rising rental-DOM trend means longer vacancies and softer asking-rent achievability than the comps imply.
CashFlowRE · CFR-HY5XEVCGFQDB5G
· Data 1 h ago
cashflowre.app · 2026-05-29