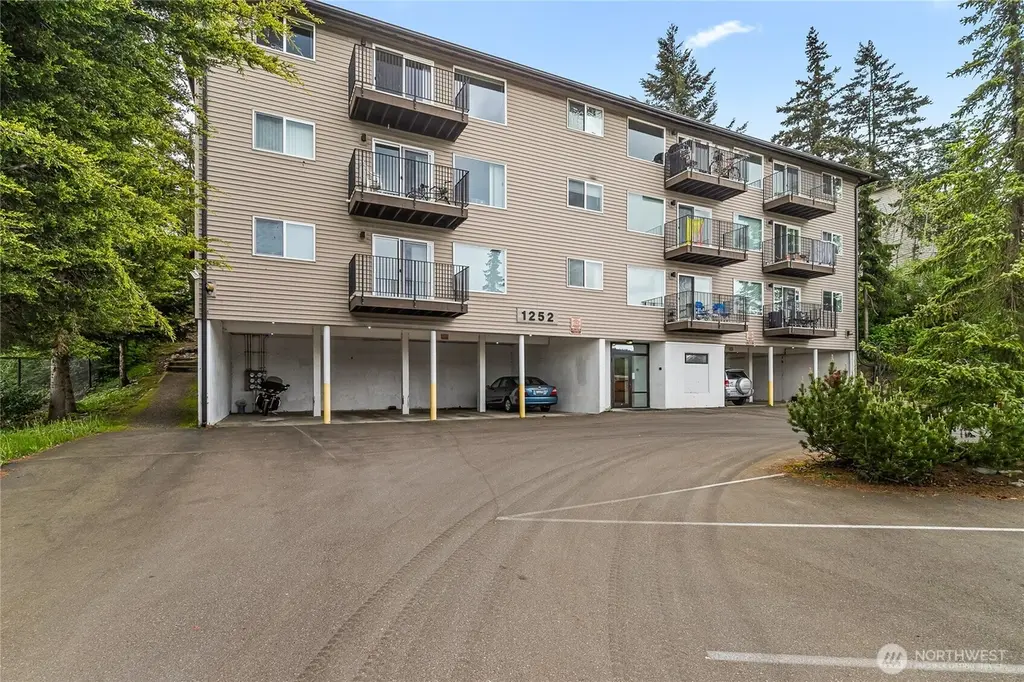
1252 Nevada St
Bellingham, WA 98226
$3,400,000C-
34 bd · 17.0 ba ·
12,768 sqft ·
Built 1979
· MultiFamily
· Active
· 10 DOM
Cashflow @ list (25.0% down · 7.5%)
Estimated rent
$30,829/mo
Mortgage (P&I)
−$17,830
Tax + insurance
−$3,197
HOA
−$0
Vac / Maint / Mgmt
−$6,474
Net cashflow
$3,328/mo
Annual
$39,941/yr
Cap rate
7.47%
Cash-on-cash
4.20%
DSCR
1.19
1% rule
0.91%
Cash to close
$952,000
Investor read
- This is a 12×1bd/1.0ba + 5×2bd/1.0ba units multifamily listed at $3.40M.
- At list price, monthly cash flow is $3k ($40k/yr) — positive. Per door: $196/mo.
- The deal already cash-flows at list — no discount required.
- To meet the 1% rule (rent ≥ 1% of price), the offer needs to be $3.08M (9.3% below list).
- Only 10 days on market — expect competitive offers; lowballing is unlikely to land.
- Recommended offer: $3.08M (9.3% below list) — sets the bar for 1% rule.
- Local home prices are declining (-3.0%/yr); year-one equity from $24k of loan paydown is wiped out by about $102k of value loss. Plan a longer hold.
- Location reads 80/100 on livability (#102 in WA, #1,947 nationally) — a professional / high-income tenant draw. Strengths: amenities A+, commute A+, health & safety A+; Watch: crime F, cost of living F.
- Bellingham School District (urban): math 47% / reading 63% proficiency, ranked #106 of 291 in WA (top 36%) — acceptable for families but not a draw, mixed tenant base, ~2y average lease.
- Zoned schools: Carl Cozier Elementary School (321 students, 43% FRL); Kulshan Middle School (623 students, 30% FRL); Sehome High School (1,163 students, 25% FRL) — zoned schools at 33% FRL track the district average.
- Market conditions: Rents flat; 381 active listings in the ZIP; solid renter incomes; 1,190 units permitted in Whatcom County in 2024 (327 in 5+ unit buildings).
- Whatcom County population projected at +28% by 2050 — long-run rental-demand tailwind backs the buy-and-hold thesis.
- Current owner paid $420k; list at $3.40M implies a 710% gain — meaningful room to come down on a strong offer.
- Cap rate 7.5% vs local median 2.0% in Bellingham — top-decile yield for the area; either an underpriced asset or a hidden risk that comps aren't pricing in. Stress-test before assuming the spread holds.
- At $30,829/mo this rent would consume 466% of the median local household income ($79k/yr) (locally 2061% of renters already pay >50% of income on rent) — very limited rent-growth headroom before tenants either downsize or default.
Questions for listing agent
- Can we see the unit-by-unit rent roll, current vacancy, and any below-market leases? What's the average tenancy length?
- What capital expenditures (roof, boiler, parking lot, exteriors) have been made in the last 5 years, and what's planned in the next 2?
- Built in 1979 — when were the roof, HVAC, electrical panel, plumbing, and water heater last replaced?
- Is there a deadline driving the sale (1031 exchange, divorce, estate, relocation)? That informs how much negotiation room exists.
- Schools are B-rated — typically a magnet for longer-tenancy family renters. What's the average tenant stay here, and is there a school-zone premium baked into asking?
- Crime grade is F in this area — have there been break-ins, vandalism, or insurance claims at this property in the last 3 years? What carrier currently insures it and at what premium?
- What's the average days-on-market for RENTAL listings here right now (not sales)? A rising rental-DOM trend means longer vacancies and softer asking-rent achievability than the comps imply.
- What's the recent tenant-quality profile in this submarket — average credit score on applications, eviction rate, late-payment / NSF rate, and stable-employment percentage? A property-management company in the area should have these aggregated.
CashFlowRE · CFR-HYFK17FJE01113
· Data 14 h ago
cashflowre.app · 2026-05-29