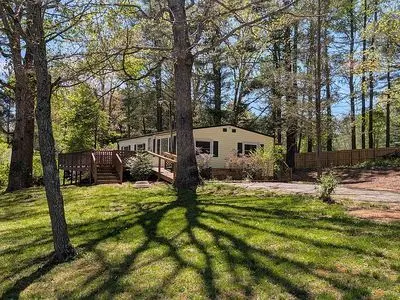
63 Sunnybrook Ln
Fletcher, NC 28732
$229,950D
2 bd · 1.0 ba ·
828 sqft ·
Built 1978
· Manufactured
· Active
· 19 DOM
Cashflow @ list (25.0% down · 7.5%)
Estimated rent
$1,760/mo
Mortgage (P&I)
−$1,206
Tax + insurance
−$135
HOA
−$0
Vac / Maint / Mgmt
−$370
Net cashflow
$49/mo
Annual
$594/yr
Cap rate
6.55%
Cash-on-cash
0.92%
DSCR
1.04
1% rule
0.77%
Cash to close
$64,386
Investor read
- This is a 2-bed/1.0-bath manufactured listed at $230k.
- At list price, monthly cash flow is $49 ($594/yr) — positive.
- The deal already cash-flows at list — no discount required.
- To meet the 1% rule (rent ≥ 1% of price), the offer needs to be $176k (23.4% below list).
- It's been on market 19 days — a 2% lower offer ($226k) is reasonable based on typical stale-listing flexibility.
- Recommended offer: $176k (23.4% below list) — sets the bar for 1% rule.
- Local home prices are declining (-3.0%/yr); year-one equity from $2k of loan paydown is wiped out by about $7k of value loss. Plan a longer hold.
- Location reads 70/100 on livability (#129 in NC) — a middle-class / working-renter tenant base. Strengths: crime A+, housing A+, employment B+; Watch: amenities F, commute F, health & safety F.
- Henderson County Schools (suburban): math 48% / reading 52% proficiency, ranked #64 of 178 in NC (top 36%) — acceptable for families but not a draw, mixed tenant base, ~2y average lease.
- Zoned schools: Glenn C Marlow Elementary (math 70% / reading 70%, grade A-, #90 of 1,410 statewide, top 7%, 580 students, 30% FRL); Rugby Middle (math 61% / reading 66%, grade B+, #35 of 475 statewide, top 7%, 804 students, 39% FRL); West Henderson High (math 73% / reading 63%, grade B, #137 of 535 statewide, top 26%, 1,087 students, 34% FRL).
- Zoned-school proficiency averages 67% at this address vs 50% district-wide (+17 pts) — the actual schools serving this property are materially stronger than the Henderson County Schools average implies; a family-tenant draw the district grade alone would hide.
- Market conditions: 215 active listings in the ZIP; 3 comparable units currently listed for rent nearby; rentals at typical pace (median 16d on market — plan ~3-4 weeks tenant-placement turnaround); solid renter incomes; 1,534 units permitted in Henderson County in 2024 (558 in 5+ unit buildings).
- Henderson County population projected at +20% by 2050 — long-run rental-demand tailwind backs the buy-and-hold thesis.
- Cap rate 6.6% vs local median 3.9% in Fletcher — top-decile yield for the area; either an underpriced asset or a hidden risk that comps aren't pricing in. Stress-test before assuming the spread holds.
Questions for listing agent
- Built in 1978 — when were the roof, HVAC, electrical panel, plumbing, and water heater last replaced?
- Is there a deadline driving the sale (1031 exchange, divorce, estate, relocation)? That informs how much negotiation room exists.
- Schools are B-rated — typically a magnet for longer-tenancy family renters. What's the average tenant stay here, and is there a school-zone premium baked into asking?
- The area grade is low — what's the realistic commute time and amenity access for the typical tenant pool here? Any planned neighborhood developments (good or bad) we should know about?
- What's the average days-on-market for RENTAL listings here right now (not sales)? A rising rental-DOM trend means longer vacancies and softer asking-rent achievability than the comps imply.
- What's the recent tenant-quality profile in this submarket — average credit score on applications, eviction rate, late-payment / NSF rate, and stable-employment percentage? A property-management company in the area should have these aggregated.
- How much new for-sale + rental construction is in the pipeline within 1–3 miles? Heavy new supply typically softens prices + rents 12–24 months out; constrained supply supports both.
CashFlowRE · CFR-HYQYB4764EEW7J
· Data 22 h ago
cashflowre.app · 2026-05-29