39-50 52nd St
New York, NY 11377
$380,000D
1 bd · 1.0 ba ·
670 sqft ·
Built —
· Other
· Active
· 41 DOM
Cashflow @ list (25.0% down · 7.5%)
Estimated rent
$3,300/mo
Mortgage (P&I)
−$1,993
Tax + insurance
−$633
HOA
−$0
Vac / Maint / Mgmt
−$693
Net cashflow
$-19/mo
Annual
$-225/yr
Cap rate
6.23%
Cash-on-cash
-0.21%
DSCR
0.99
1% rule
0.87%
Cash to close
$106,400
Investor read
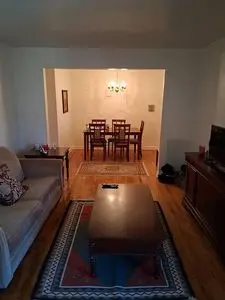
- This is a 1-bed/1.0-bath other listed at $380k. Condition is rated fair.
- At list price, monthly cash flow is $-19 ($-225/yr) — negative.
- To cash-flow at today's rent, offer at most $377k (0.7% below list).
- To meet the 1% rule (rent ≥ 1% of price), the offer needs to be $330k (13.1% below list).
- It's been on market 41 days — a 3% lower offer ($369k) is reasonable based on typical stale-listing flexibility.
- Recommended offer: $330k (13.1% below list) — sets the bar for 1% rule.
- Local home prices are declining (-3.0%/yr); year-one equity from $3k of loan paydown is wiped out by about $11k of value loss. Plan a longer hold.
- Location reads 75/100 on livability (#268 in NY, #4,188 nationally) — a middle-class / working-renter tenant base. Strengths: amenities A+, commute A+, health & safety A; Watch: crime F, cost of living F.
- Zoned schools: Elm Tree Elementary School (math 27% / reading 52%, grade F, #1,444 of 2,108 statewide, top 71%, 806 students, 94% FRL); Is 227 Louis Armstrong (math 52% / reading 69%, grade B+, #153 of 729 statewide, top 21%, 1,528 students, 68% FRL); Midwood High School (math 94% / reading 96%, grade A+, #83 of 1,100 statewide, top 8%, 4,062 students, 73% FRL).
- Market conditions: Rents rising fast (+6.1%/yr); 351 active listings in the ZIP; 3 comparable units currently listed for rent nearby; rentals leasing fast (median 13d on market — plan ~1-2 weeks tenant-placement turnaround); 5,302 units permitted in Queens County in 2024 (4,918 in 5+ unit buildings).
- Queens County population projected at +16% by 2050 — long-run rental-demand tailwind backs the buy-and-hold thesis.
- Climate carrying-cost: major wind risk, 27% chance of damaging wind over 30y; extreme-heat days projected 7→14/yr by 2055 (HVAC capex compounding) — expect insurance premiums to compound above CPI over the hold.
- Cap rate 6.2% vs local median 2.6% in New York — top-decile yield for the area; either an underpriced asset or a hidden risk that comps aren't pricing in. Stress-test before assuming the spread holds.
- At $3,300/mo this rent would consume 54% of the median local household income ($73k/yr) (locally 5474% of renters already pay >50% of income on rent) — very limited rent-growth headroom before tenants either downsize or default.
Questions for listing agent
- What do current leases actually rent for vs. the listed asking? Can we see a recent rent roll and the last 12 months of T-12 income?
- It's been on market 41 days. Have you received any prior offers? Is the seller open to a 13% concession, seller financing, or rate buy-down credit?
- Have any recent inspections been done? Can we get a copy of the seller's disclosures and any deferred-maintenance estimates?
- Is there a deadline driving the sale (1031 exchange, divorce, estate, relocation)? That informs how much negotiation room exists.
- Schools are B-rated — typically a magnet for longer-tenancy family renters. What's the average tenant stay here, and is there a school-zone premium baked into asking?
- Crime grade is F in this area — have there been break-ins, vandalism, or insurance claims at this property in the last 3 years? What carrier currently insures it and at what premium?
- The area grade is low — what's the realistic commute time and amenity access for the typical tenant pool here? Any planned neighborhood developments (good or bad) we should know about?
- What's the average days-on-market for RENTAL listings here right now (not sales)? A rising rental-DOM trend means longer vacancies and softer asking-rent achievability than the comps imply.
Repairs flagged (vision-AI assessment)
- Minor: Paint — Paint appears slightly worn
CashFlowRE · CFR-HZCBAK737KXW2E
· Data 1 day ago
cashflowre.app · 2026-05-29