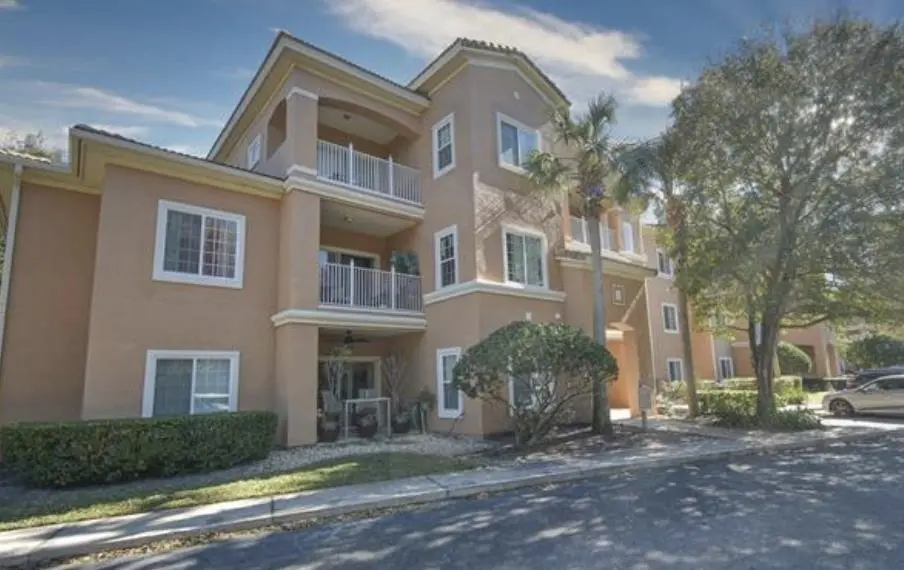
615 Fairway Dr #101
St. Augustine, FL 32084
$189,000D-
3 bd · 2.0 ba ·
1,285 sqft ·
Built 2001
· Condo
· Active
· 76 DOM
Cashflow @ list (25.0% down · 7.5%)
Estimated rent
$1,978/mo
Mortgage (P&I)
−$991
Tax + insurance
−$259
HOA
−$420
Vac / Maint / Mgmt
−$415
Net cashflow
$-108/mo
Annual
$-1,299/yr
Cap rate
5.61%
Cash-on-cash
-2.45%
DSCR
0.89
1% rule
1.05%
Cash to close
$52,920
Investor read
- This is a 3-bed/2.0-bath condo listed at $189k.
- At list price, monthly cash flow is $-108 ($-1k/yr) — negative.
- To cash-flow at today's rent, offer at most $170k (10.1% below list).
- Meets the 1% rule at list price ($2k rent vs $189k).
- It's been on market 76 days — a 6% lower offer ($178k) is reasonable based on typical stale-listing flexibility.
- Recommended offer: $170k (10.1% below list) — sets the bar for cash-flow.
- Local home prices are declining (-3.0%/yr); year-one equity from $1k of loan paydown is wiped out by about $6k of value loss. Plan a longer hold.
- Location reads: area grade D — affects rentability + tenant quality, not the cash-flow math above.
- St. Johns (rural): math 75% / reading 73% proficiency, ranked #2 of 73 in FL (top 3%) — strong family-tenant draw, lease renewals of 3-5y typical; only 20% free/reduced lunch — higher-income household profile.
- Watch-outs: HOA is 21% of rent.
- Market conditions: Rents flat; 631 active listings in the ZIP; 28 comparable units currently listed for rent nearby; rentals at typical pace (median 20d on market — plan ~3-4 weeks tenant-placement turnaround); 5,575 units permitted in St. Johns County in 2024 (584 in 5+ unit buildings).
- St. Johns County population projected at +60% by 2050 — long-run rental-demand tailwind backs the buy-and-hold thesis.
- 5 sale attempts since 8y ago; this cycle's ask has dropped $10k (5%) from the opening price — seller is motivated, your offer sets the floor, not the list.
- Current owner paid $144k; 31% above their basis — modest negotiation headroom, anchor on the comps not their cost.
- Climate carrying-cost: severe wind risk, 99% chance of damaging wind over 30y; extreme-heat days projected 7→21/yr by 2055 (HVAC capex compounding) — expect insurance premiums to compound above CPI over the hold.
- Cap rate 5.6% vs local median 3.1% in St. Augustine — top-decile yield for the area; either an underpriced asset or a hidden risk that comps aren't pricing in. Stress-test before assuming the spread holds.
- This rent runs 32% of the median local income ($74k/yr) — at the standard rent-burdened threshold; future hikes will face affordability resistance.
Questions for listing agent
- What do current leases actually rent for vs. the listed asking? Can we see a recent rent roll and the last 12 months of T-12 income?
- It's been on market 76 days. Have you received any prior offers? Is the seller open to a 10% concession, seller financing, or rate buy-down credit?
- What does the HOA fee cover, when was the last increase, and are there any pending special assessments or reserve-fund shortfalls?
- Any open or pending special assessments — roof, HVAC, plumbing, elevator, façade? What's the per-unit balance and payoff schedule, and is the seller paying it off at close or rolling it to the buyer?
- Why hasn't it sold? Are there any deal-killer items the seller is aware of (foundation, flood, title, zoning, code violations)?
- Is there a deadline driving the sale (1031 exchange, divorce, estate, relocation)? That informs how much negotiation room exists.
- The area grade is low — what's the realistic commute time and amenity access for the typical tenant pool here? Any planned neighborhood developments (good or bad) we should know about?
- What's the average days-on-market for RENTAL listings here right now (not sales)? A rising rental-DOM trend means longer vacancies and softer asking-rent achievability than the comps imply.
CashFlowRE · CFR-HZMCS32X7VNG2C
· Data 2 days ago
cashflowre.app · 2026-05-29