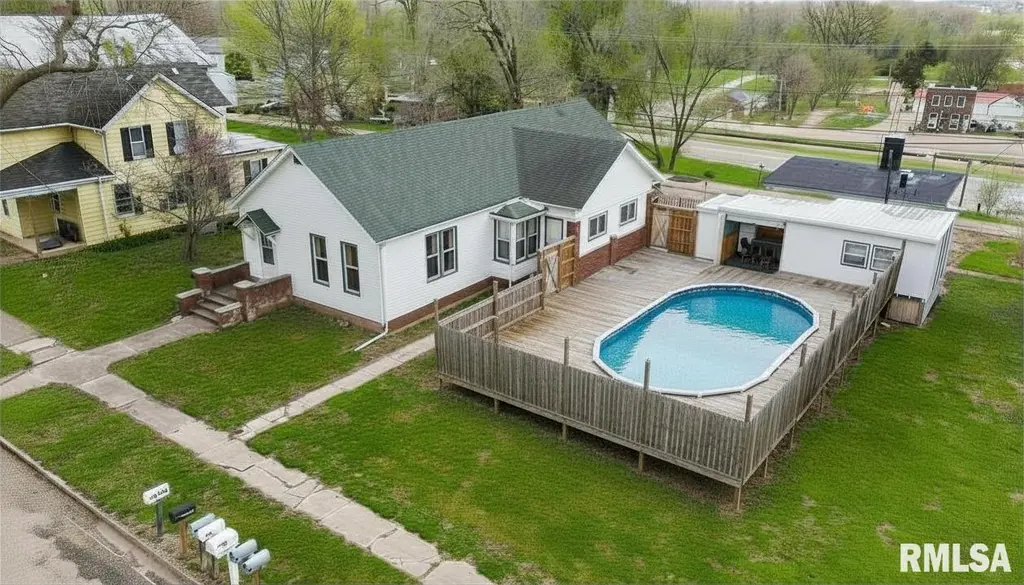
105 N 1st St
Sparland, IL 61565
$120,000C-
3 bd · 1.0 ba ·
1,668 sqft ·
Built 1910
· SingleFamily
· Pending
· 26 DOM
Cashflow @ list (25.0% down · 7.5%)
Estimated rent
$1,134/mo
Mortgage (P&I)
−$629
Tax + insurance
−$144
HOA
−$0
Vac / Maint / Mgmt
−$238
Net cashflow
$123/mo
Annual
$1,473/yr
Cap rate
7.52%
Cash-on-cash
4.38%
DSCR
1.20
1% rule
0.94%
Cash to close
$33,600
Investor read
- This is a 3-bed/1.0-bath single-family listed at $120k.
- At list price, monthly cash flow is $123 ($1k/yr) — positive.
- The deal already cash-flows at list — no discount required.
- To meet the 1% rule (rent ≥ 1% of price), the offer needs to be $113k (5.5% below list).
- It's been on market 26 days — a 2% lower offer ($118k) is reasonable based on typical stale-listing flexibility.
- Recommended offer: $113k (5.5% below list) — sets the bar for 1% rule.
- In year one you build about $13k of equity ($830 loan paydown + $12k appreciation (10.0% local appreciation)).
- Location reads 56/100 on livability (#1,228 in IL) — a working-class tenant base; expect higher turnover. Strengths: cost of living A+, housing A-; Watch: crime D-, amenities F, commute F.
- Midland CUSD 7 (rural): math 24% / reading 46% proficiency, ranked #189 of 620 in IL (top 30%) — families likely to look elsewhere, expect single-tenant / working-renter base with shorter leases.
- Zoned schools: Midland Elementary School (math 17% / reading 27%, grade F, #940 of 2,056 statewide, top 49%, 274 students, 0% FRL); Midland Middle School (math 27% / reading 57%, grade D-, #116 of 665 statewide, top 19%, 196 students, 0% FRL); Midland High School (math 24% / reading 34%, grade F, #187 of 693 statewide, top 30%, 195 students, 0% FRL) — zoned schools average 0% FRL vs 36% district-wide (36 pts lower); this property's tenant base skews higher-income than the district average.
- Watch-outs: built in 1910 — expect roof / HVAC / electrical / plumbing capex.
- Market conditions: 7 active listings in the ZIP; 9 units permitted in Marshall County in 2024 (0 in 5+ unit buildings).
- Marshall County population projected at -32% by 2050 — secular population decline; favor cash flow + early exit over multi-decade hold.
- At projected returns (10.0% appreciation + 3.0% rent growth), your $34k cash investment doubles in ~3 years — after that, you're playing with house money.
- By year 3, paydown + projected appreciation supports a ~$32k cash-out refi (75% LTV) — recoverable capital for the next deal without selling this one.
Questions for listing agent
- Built in 1910 — when were the roof, HVAC, electrical panel, plumbing, and water heater last replaced?
- Is there a deadline driving the sale (1031 exchange, divorce, estate, relocation)? That informs how much negotiation room exists.
- Schools are F-rated, which usually means shorter tenancies and higher turnover. Who's the typical renter profile here, and what's been the actual vacancy rate?
- Crime grade is D in this area — have there been break-ins, vandalism, or insurance claims at this property in the last 3 years? What carrier currently insures it and at what premium?
- What's the average days-on-market for RENTAL listings here right now (not sales)? A rising rental-DOM trend means longer vacancies and softer asking-rent achievability than the comps imply.
- What's the recent tenant-quality profile in this submarket — average credit score on applications, eviction rate, late-payment / NSF rate, and stable-employment percentage? A property-management company in the area should have these aggregated.
- How much new for-sale + rental construction is in the pipeline within 1–3 miles? Heavy new supply typically softens prices + rents 12–24 months out; constrained supply supports both.
CashFlowRE · CFR-J10SZ7E061ZNK9
· Data 4 weeks ago
cashflowre.app · 2026-05-29