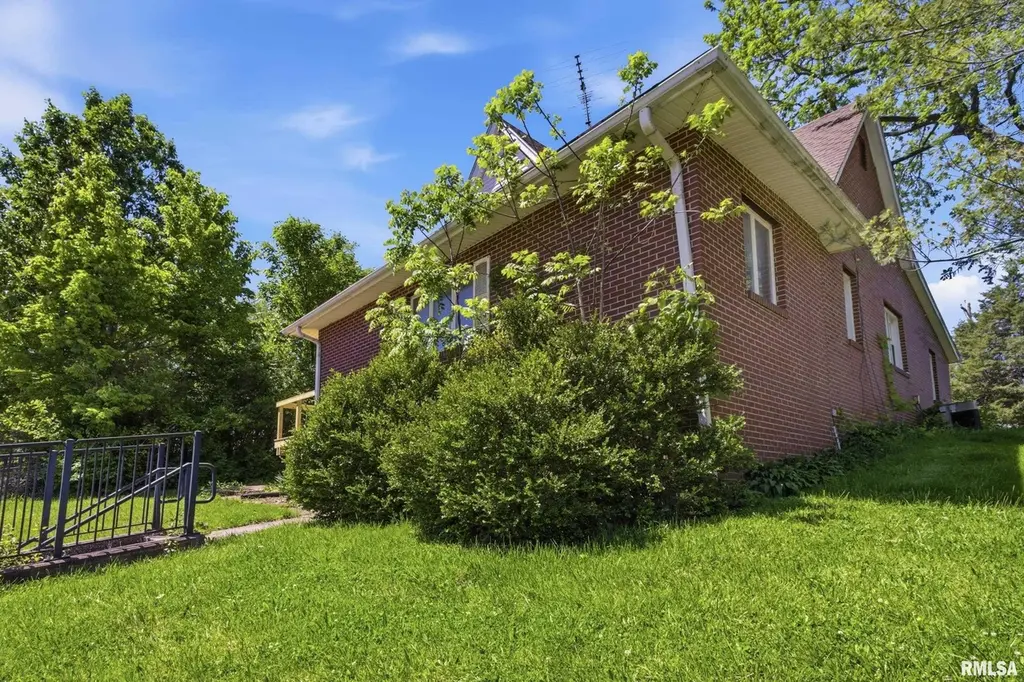
812 N Lafayette St
Macomb, IL 61455
$89,500C
4 bd · 2.0 ba ·
1,322 sqft ·
Built 1920
· Other
· Active
· 35 DOM
Cashflow @ list (25.0% down · 7.5%)
Estimated rent
$1,300/mo
Mortgage (P&I)
−$469
Tax + insurance
−$282
HOA
−$0
Vac / Maint / Mgmt
−$273
Net cashflow
$275/mo
Annual
$3,303/yr
Cap rate
9.98%
Cash-on-cash
13.18%
DSCR
1.59
1% rule
1.45%
Cash to close
$25,060
Investor read
- This is a 4-bed/2.0-bath other listed at $90k.
- At list price, monthly cash flow is $275 ($3k/yr) — positive.
- The deal already cash-flows at list — no discount required.
- Meets the 1% rule at list price ($1k rent vs $90k).
- It's been on market 35 days — a 3% lower offer ($87k) is reasonable based on typical stale-listing flexibility.
- Recommended offer: $87k (3.0% below list) — sets the bar for market timing.
- Local home prices are declining (-3.0%/yr); year-one equity from $619 of loan paydown is wiped out by about $3k of value loss. Plan a longer hold.
- Location reads 70/100 on livability (#379 in IL) — a middle-class / working-renter tenant base. Strengths: cost of living A+, health & safety A+, housing B; Watch: crime D, amenities D, commute F.
- Macomb CUSD 185 (town): math 19% / reading 26% proficiency, ranked #410 of 620 in IL (top 66%) — low school quality limits family demand, transient renter base, plan for 1-2y turnover.
- Zoned schools: Macomb Junior High School (math 21% / reading 32%, grade F, #312 of 665 statewide, top 48%, 308 students, 0% FRL); Macomb Senior High School (math 27% / reading 37%, grade F, #157 of 693 statewide, top 25%, 622 students, 0% FRL) — zoned schools average 0% FRL vs 40% district-wide (40 pts lower); this property's tenant base skews higher-income than the district average.
- Watch-outs: property tax is 3.3% of price; built in 1920 — expect roof / HVAC / electrical / plumbing capex.
- Market conditions: 135 active listings in the ZIP; 1 comparable units currently listed for rent nearby.
- At projected returns (-3.0% appreciation + 3.0% rent growth), your $25k cash investment doubles in ~9 years — after that, you're playing with house money.
- Cap rate 10.0% vs local median 6.2% in Macomb — top-decile yield for the area; either an underpriced asset or a hidden risk that comps aren't pricing in. Stress-test before assuming the spread holds.
- This rent runs 32% of the median local income ($49k/yr) — at the standard rent-burdened threshold; future hikes will face affordability resistance.
Questions for listing agent
- It's been on market 35 days. Have you received any prior offers? Is the seller open to a 3% concession, seller financing, or rate buy-down credit?
- Built in 1920 — when were the roof, HVAC, electrical panel, plumbing, and water heater last replaced?
- Property tax is high relative to price — has the assessment been appealed recently, and will the sale trigger a re-assessment?
- Is there a deadline driving the sale (1031 exchange, divorce, estate, relocation)? That informs how much negotiation room exists.
- Schools are D-rated, which usually means shorter tenancies and higher turnover. Who's the typical renter profile here, and what's been the actual vacancy rate?
- Crime grade is D in this area — have there been break-ins, vandalism, or insurance claims at this property in the last 3 years? What carrier currently insures it and at what premium?
- What's the average days-on-market for RENTAL listings here right now (not sales)? A rising rental-DOM trend means longer vacancies and softer asking-rent achievability than the comps imply.
- What's the recent tenant-quality profile in this submarket — average credit score on applications, eviction rate, late-payment / NSF rate, and stable-employment percentage? A property-management company in the area should have these aggregated.
CashFlowRE · CFR-J2Y79FDFSZ1A7X
· Data 1 day ago
cashflowre.app · 2026-05-29