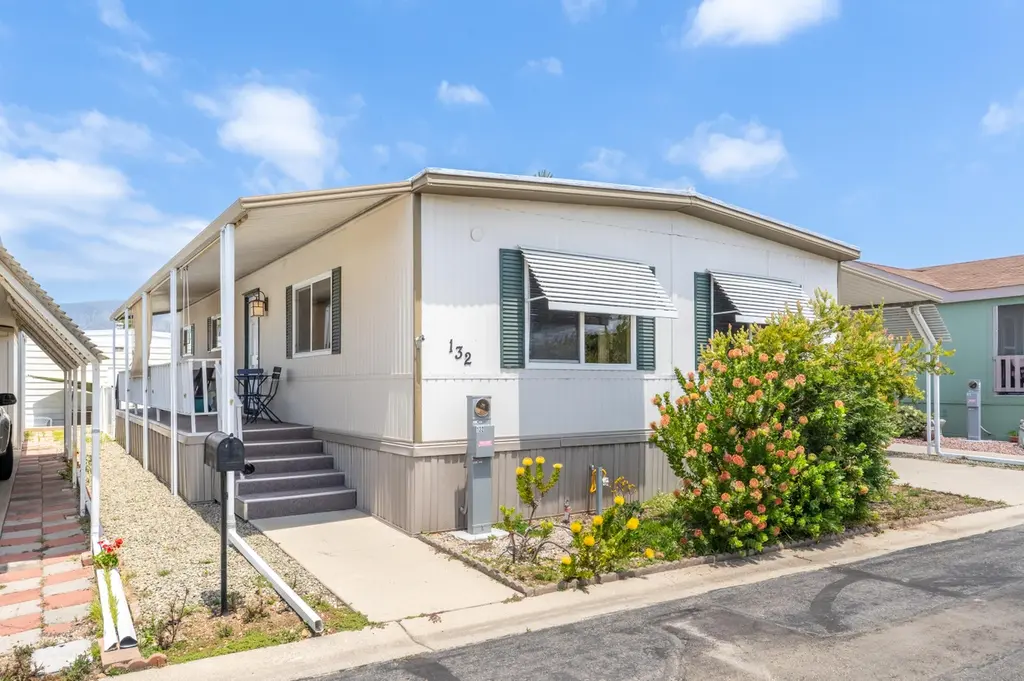
132 Don Felipe Way
Mira Monte, CA 93023
$315,000C-
2 bd · 2.0 ba ·
1,200 sqft ·
Built 1971
· Manufactured
· Active
· 30 DOM
Cashflow @ list (25.0% down · 7.5%)
Estimated rent
$3,507/mo
Mortgage (P&I)
−$1,652
Tax + insurance
−$525
HOA
−$0
Vac / Maint / Mgmt
−$736
Net cashflow
$594/mo
Annual
$7,124/yr
Cap rate
8.55%
Cash-on-cash
8.08%
DSCR
1.36
1% rule
1.11%
Cash to close
$88,200
Investor read
- This is a 2-bed/2.0-bath manufactured listed at $315k.
- At list price, monthly cash flow is $594 ($7k/yr) — positive.
- The deal already cash-flows at list — no discount required.
- Meets the 1% rule at list price ($4k rent vs $315k).
- It's been on market 30 days — a 2% lower offer ($310k) is reasonable based on typical stale-listing flexibility.
- Recommended offer: $310k (1.5% below list) — sets the bar for market timing.
- Local home prices are declining (-3.0%/yr); year-one equity from $2k of loan paydown is wiped out by about $9k of value loss. Plan a longer hold.
- Location reads 64/100 on livability (#401 in CA) — a middle-class / working-renter tenant base. Strengths: commute A+, employment A+, crime A-; Watch: amenities F, cost of living F.
- Ojai Unified (suburban): math 27% / reading 43% proficiency, ranked #257 of 517 in CA (top 50%) — families likely to look elsewhere, expect single-tenant / working-renter base with shorter leases.
- Market conditions: 135 active listings in the ZIP; 5 comparable units currently listed for rent nearby; rentals at typical pace (median 20d on market — plan ~3-4 weeks tenant-placement turnaround); 40% of comp listings sitting > 30 days — soft ceiling on asking rent; solid renter incomes; 1,759 units permitted in Ventura County in 2024 (1,196 in 5+ unit buildings).
- Ventura County population projected at +4% by 2050 — modest demand growth; plan on rents tracking national, not racing it.
- 5 sale attempts since 12y ago with the ask held roughly flat each time — persistent listings suggest the price (not the market) is what's stuck; bring a comps-based counter.
- Climate carrying-cost: moderate wildfire risk; extreme-heat days projected 7→19/yr by 2055 (HVAC capex compounding) — expect insurance premiums to compound above CPI over the hold.
- Cap rate 8.6% vs local median 3.2% in Mira Monte — top-decile yield for the area; either an underpriced asset or a hidden risk that comps aren't pricing in. Stress-test before assuming the spread holds.
- At $3,507/mo this rent would consume 52% of the median local household income ($81k/yr) (locally 723% of renters already pay >50% of income on rent) — very limited rent-growth headroom before tenants either downsize or default.
Questions for listing agent
- Built in 1971 — when were the roof, HVAC, electrical panel, plumbing, and water heater last replaced?
- Is there a deadline driving the sale (1031 exchange, divorce, estate, relocation)? That informs how much negotiation room exists.
- Schools are B-rated — typically a magnet for longer-tenancy family renters. What's the average tenant stay here, and is there a school-zone premium baked into asking?
- What's the average days-on-market for RENTAL listings here right now (not sales)? A rising rental-DOM trend means longer vacancies and softer asking-rent achievability than the comps imply.
- What's the recent tenant-quality profile in this submarket — average credit score on applications, eviction rate, late-payment / NSF rate, and stable-employment percentage? A property-management company in the area should have these aggregated.
- How much new for-sale + rental construction is in the pipeline within 1–3 miles? Heavy new supply typically softens prices + rents 12–24 months out; constrained supply supports both.
CashFlowRE · CFR-J7N0DGD0C14RV2
· Data 2 days ago
cashflowre.app · 2026-05-29