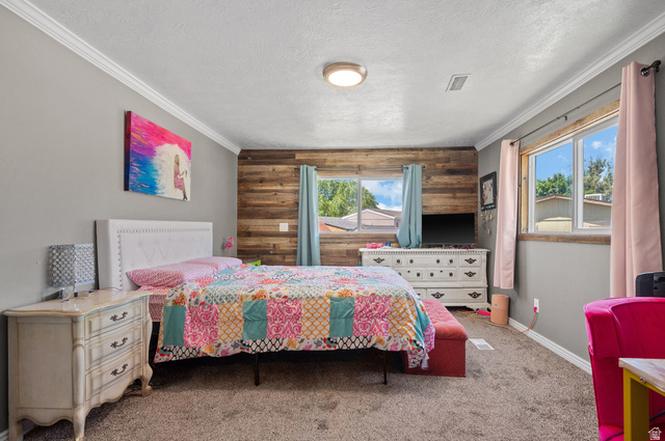
11259 S Crescent Park Cir #172
Sandy, UT 84070
$127,900D
4 bd · 2.0 ba ·
1,380 sqft ·
Built 1973
· Manufactured
· Active
· 5 DOM
Cashflow @ list (25.0% down · 7.5%)
Estimated rent
$2,500/mo
Mortgage (P&I)
−$671
Tax + insurance
−$213
HOA
−$1,200
Vac / Maint / Mgmt
−$525
Net cashflow
$-109/mo
Annual
$-1,305/yr
Cap rate
5.27%
Cash-on-cash
-3.64%
DSCR
0.84
1% rule
1.95%
Cash to close
$35,812
Investor read
- This is a 4-bed/2.0-bath manufactured listed at $128k.
- At list price, monthly cash flow is $-109 ($-1k/yr) — negative.
- To cash-flow at today's rent, offer at most $112k (12.3% below list).
- Meets the 1% rule at list price ($2k rent vs $128k).
- Only 5 days on market — expect competitive offers; lowballing is unlikely to land.
- Recommended offer: $112k (12.3% below list) — sets the bar for cash-flow.
- Local home prices are declining (-3.0%/yr); year-one equity from $884 of loan paydown is wiped out by about $4k of value loss. Plan a longer hold.
- Location reads 83/100 on livability (#23 in UT, #920 nationally) — a professional / high-income tenant draw. Strengths: crime A+, commute A+, employment A+; Watch: amenities F, cost of living F.
- Canyons District (suburban): math 49% / reading 53% proficiency, ranked #12 of 80 in UT (top 15%) — acceptable for families but not a draw, mixed tenant base, ~2y average lease.
- Zoned schools: Crescent School (math 42% / reading 42%, grade F, #287 of 585 statewide, top 52%, 423 students, 30% FRL); Mt. Jordan Middle (math 27% / reading 36%, grade F, #102 of 138 statewide, top 76%, 776 students, 44% FRL); Alta High (math 27% / reading 59%, grade F, #53 of 171 statewide, top 31%, 2,294 students, 15% FRL) — zoned schools at 30% FRL track the district average.
- Zoned-school proficiency averages 39% at this address vs 51% district-wide (-12 pts) — the specific schools serving this property underperform the Canyons District average; the district grade overstates school quality for this exact location.
- Watch-outs: HOA is 48% of rent.
- Market conditions: Rents soft (-2.7%/yr); 137 active listings in the ZIP; 12 comparable units currently listed for rent nearby; rentals leasing fast (median 6d on market — plan ~1-2 weeks tenant-placement turnaround); solid renter incomes; 4,970 units permitted in Salt Lake County in 2024 (1,963 in 5+ unit buildings).
- Salt Lake County population projected at +37% by 2050 — long-run rental-demand tailwind backs the buy-and-hold thesis.
- 4 sale attempts since 3y ago with the ask held roughly flat each time — persistent listings suggest the price (not the market) is what's stuck; bring a comps-based counter.
- This rent runs 38% of the median local income ($79k/yr) — at the standard rent-burdened threshold; future hikes will face affordability resistance.
Questions for listing agent
- What do current leases actually rent for vs. the listed asking? Can we see a recent rent roll and the last 12 months of T-12 income?
- Built in 1973 — when were the roof, HVAC, electrical panel, plumbing, and water heater last replaced?
- What does the HOA fee cover, when was the last increase, and are there any pending special assessments or reserve-fund shortfalls?
- Is there a deadline driving the sale (1031 exchange, divorce, estate, relocation)? That informs how much negotiation room exists.
- Schools are A-rated — typically a magnet for longer-tenancy family renters. What's the average tenant stay here, and is there a school-zone premium baked into asking?
- The area grade is low — what's the realistic commute time and amenity access for the typical tenant pool here? Any planned neighborhood developments (good or bad) we should know about?
- What's the average days-on-market for RENTAL listings here right now (not sales)? A rising rental-DOM trend means longer vacancies and softer asking-rent achievability than the comps imply.
- What's the recent tenant-quality profile in this submarket — average credit score on applications, eviction rate, late-payment / NSF rate, and stable-employment percentage? A property-management company in the area should have these aggregated.
CashFlowRE · CFR-J81X6S6QKWST1T
· Data 1 day ago
cashflowre.app · 2026-05-29