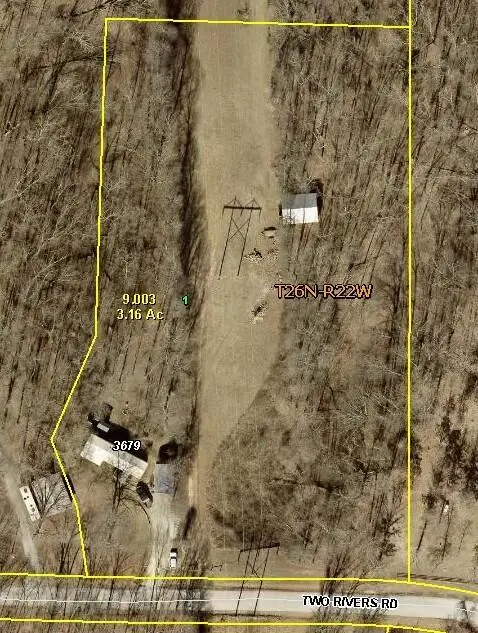
3679 Two Rivers Rd
Highlandville, MO 65669
$149,900D+
2 bd · 1.0 ba ·
1,280 sqft ·
Built 1996
· Manufactured
· Active
· 34 DOM
Cashflow @ list (25.0% down · 7.5%)
Estimated rent
$1,121/mo
Mortgage (P&I)
−$786
Tax + insurance
−$107
HOA
−$0
Vac / Maint / Mgmt
−$235
Net cashflow
$-8/mo
Annual
$-94/yr
Cap rate
6.23%
Cash-on-cash
-0.22%
DSCR
0.99
1% rule
0.75%
Cash to close
$41,972
Investor read
- This is a 2-bed/1.0-bath manufactured listed at $150k.
- At list price, monthly cash flow is $-8 ($-94/yr) — negative.
- To cash-flow at today's rent, offer at most $149k (0.9% below list).
- To meet the 1% rule (rent ≥ 1% of price), the offer needs to be $112k (25.2% below list).
- It's been on market 34 days — a 3% lower offer ($145k) is reasonable based on typical stale-listing flexibility.
- Recommended offer: $112k (25.2% below list) — sets the bar for 1% rule.
- Local home prices are declining (-2.2%/yr); year-one equity from $1k of loan paydown is wiped out by about $3k of value loss. Plan a longer hold.
- Location reads 58/100 on livability (#578 in MO) — a working-class tenant base; expect higher turnover. Strengths: cost of living A+, housing A+; Watch: employment D+, crime F, amenities F.
- Spokane R-VII (rural): math 37% / reading 43% proficiency, ranked #133 of 324 in MO (top 41%) — families likely to look elsewhere, expect single-tenant / working-renter base with shorter leases.
- Zoned schools: Highlandville Elem. (math 37% / reading 47%, grade F, #481 of 1,115 statewide, top 46%, 360 students, 44% FRL); Spokane Middle (math 37% / reading 37%, grade F, #220 of 391 statewide, top 59%, 147 students, 44% FRL); Spokane High (math 44% / reading 44%, grade F, #179 of 521 statewide, top 39%, 193 students, 28% FRL) — zoned schools at 39% FRL track the district average.
- Market conditions: 30 active listings in the ZIP; 537 units permitted in Christian County in 2024 (0 in 5+ unit buildings).
- Christian County population projected at +24% by 2050 — long-run rental-demand tailwind backs the buy-and-hold thesis.
- 3 sale attempts since 4y ago with the ask held roughly flat each time — persistent listings suggest the price (not the market) is what's stuck; bring a comps-based counter.
- Cap rate 6.2% vs local median 2.1% in Highlandville — top-decile yield for the area; either an underpriced asset or a hidden risk that comps aren't pricing in. Stress-test before assuming the spread holds.
Questions for listing agent
- What do current leases actually rent for vs. the listed asking? Can we see a recent rent roll and the last 12 months of T-12 income?
- It's been on market 34 days. Have you received any prior offers? Is the seller open to a 25% concession, seller financing, or rate buy-down credit?
- Is there a deadline driving the sale (1031 exchange, divorce, estate, relocation)? That informs how much negotiation room exists.
- Schools are D-rated, which usually means shorter tenancies and higher turnover. Who's the typical renter profile here, and what's been the actual vacancy rate?
- Crime grade is F in this area — have there been break-ins, vandalism, or insurance claims at this property in the last 3 years? What carrier currently insures it and at what premium?
- The area grade is low — what's the realistic commute time and amenity access for the typical tenant pool here? Any planned neighborhood developments (good or bad) we should know about?
- What's the average days-on-market for RENTAL listings here right now (not sales)? A rising rental-DOM trend means longer vacancies and softer asking-rent achievability than the comps imply.
- What's the recent tenant-quality profile in this submarket — average credit score on applications, eviction rate, late-payment / NSF rate, and stable-employment percentage? A property-management company in the area should have these aggregated.
CashFlowRE · CFR-J9W0DM9SPXEFR0
· Data 2 days ago
cashflowre.app · 2026-05-29