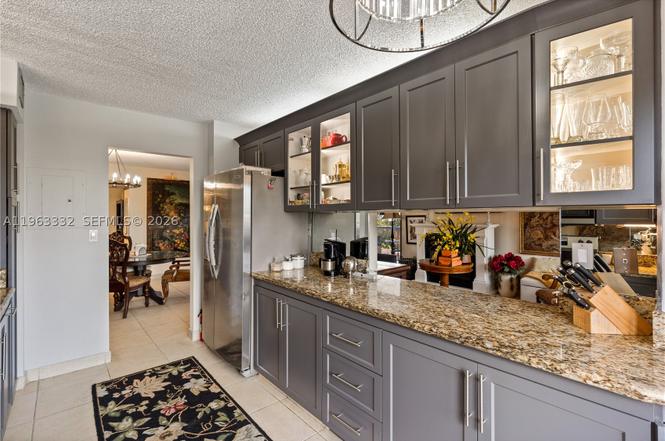
18151 NE 31st Ct #701
Aventura, FL 33160
$389,000C
3 bd · 2.0 ba ·
1,610 sqft ·
Built 1981
· Condo
· Active
· 125 DOM
Cashflow @ list (25.0% down · 7.5%)
Estimated rent
$5,487/mo
Mortgage (P&I)
−$2,040
Tax + insurance
−$648
HOA
−$1,453
Vac / Maint / Mgmt
−$1,152
Net cashflow
$193/mo
Annual
$2,317/yr
Cap rate
6.89%
Cash-on-cash
2.13%
DSCR
1.09
1% rule
1.41%
Cash to close
$108,920
Investor read
- This is a 3-bed/2.0-bath condo listed at $389k.
- At list price, monthly cash flow is $193 ($2k/yr) — positive.
- The deal already cash-flows at list — no discount required.
- Meets the 1% rule at list price ($5k rent vs $389k).
- It's been on market 125 days — a 12% lower offer ($342k) is reasonable based on typical stale-listing flexibility.
- Recommended offer: $342k (12.0% below list) — sets the bar for market timing.
- In year one you build about $5k of equity ($3k loan paydown + $2k appreciation (0.5% local appreciation)).
- Location reads 80/100 on livability (#127 in FL, #1,834 nationally) — a professional / high-income tenant draw. Strengths: schools A+, health & safety A+, amenities A; Watch: crime D+, cost of living F.
- Miami-Dade (suburban): math 45% / reading 54% proficiency, ranked #40 of 73 in FL (top 55%) — families likely to look elsewhere, expect single-tenant / working-renter base with shorter leases; 64% free/reduced lunch — lower-income household profile, screen leases tightly.
- Watch-outs: HOA is 26% of rent.
- Market conditions: Rents flat; 1870 active listings in the ZIP; 4 comparable units currently listed for rent nearby; rentals leasing fast (median 11d on market — plan ~1-2 weeks tenant-placement turnaround); 10,051 units permitted in Miami-Dade County in 2024 (7,758 in 5+ unit buildings).
- Miami-Dade County population projected at +28% by 2050 — long-run rental-demand tailwind backs the buy-and-hold thesis.
- 2 sale attempts since 8y ago; this cycle's ask has dropped $86k (18%) from the opening price — seller is motivated, your offer sets the floor, not the list.
- Current owner paid $300k; 30% above their basis — modest negotiation headroom, anchor on the comps not their cost.
- By year 7, paydown + projected appreciation supports a ~$35k cash-out refi (75% LTV) — recoverable capital for the next deal without selling this one.
- Cap rate 6.9% vs local median 2.6% in Aventura — top-decile yield for the area; either an underpriced asset or a hidden risk that comps aren't pricing in. Stress-test before assuming the spread holds.
- At $5,487/mo this rent would consume 98% of the median local household income ($67k/yr) (locally 3106% of renters already pay >50% of income on rent) — very limited rent-growth headroom before tenants either downsize or default.
Questions for listing agent
- It's been on market 125 days. Have you received any prior offers? Is the seller open to a 12% concession, seller financing, or rate buy-down credit?
- What does the HOA fee cover, when was the last increase, and are there any pending special assessments or reserve-fund shortfalls?
- Any open or pending special assessments — roof, HVAC, plumbing, elevator, façade? What's the per-unit balance and payoff schedule, and is the seller paying it off at close or rolling it to the buyer?
- Why hasn't it sold? Are there any deal-killer items the seller is aware of (foundation, flood, title, zoning, code violations)?
- Is there a deadline driving the sale (1031 exchange, divorce, estate, relocation)? That informs how much negotiation room exists.
- Schools are A-rated — typically a magnet for longer-tenancy family renters. What's the average tenant stay here, and is there a school-zone premium baked into asking?
- Crime grade is D in this area — have there been break-ins, vandalism, or insurance claims at this property in the last 3 years? What carrier currently insures it and at what premium?
- What's the average days-on-market for RENTAL listings here right now (not sales)? A rising rental-DOM trend means longer vacancies and softer asking-rent achievability than the comps imply.
CashFlowRE · CFR-JAAT154SDWSG1G
· Data 2 days ago
cashflowre.app · 2026-05-29