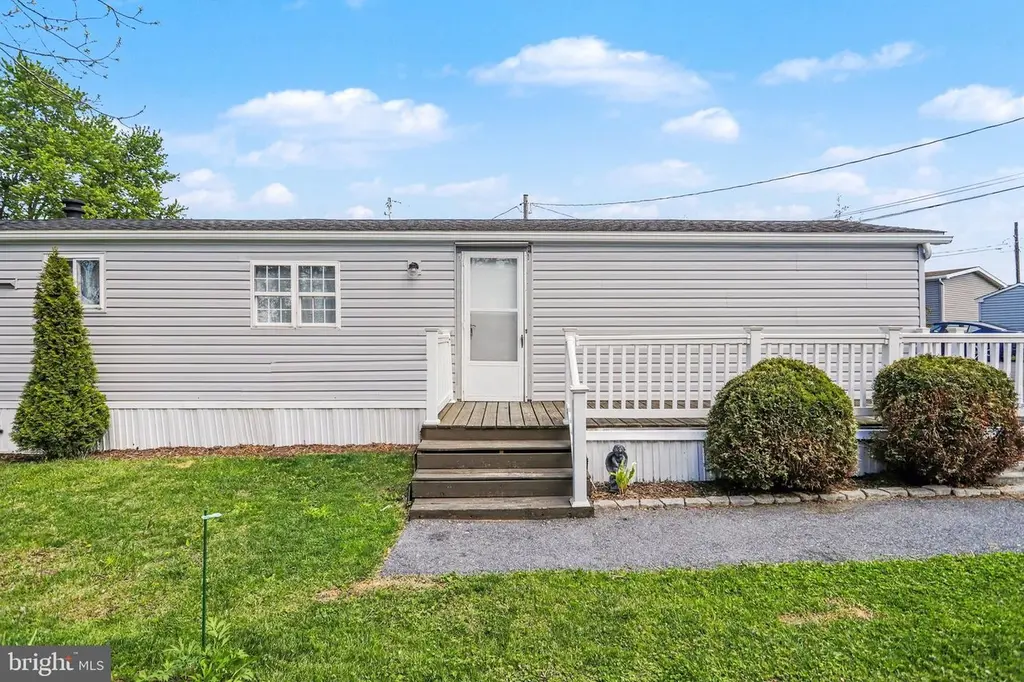
326 Don Dr
East Earl, PA 17557
$54,900B-
2 bd · 1.0 ba ·
980 sqft ·
Built 1992
· Manufactured
· Pending
· 7 DOM
Cashflow @ list (25.0% down · 7.5%)
Estimated rent
$1,152/mo
Mortgage (P&I)
−$288
Tax + insurance
−$40
HOA
−$0
Vac / Maint / Mgmt
−$242
Net cashflow
$582/mo
Annual
$6,983/yr
Cap rate
19.01%
Cash-on-cash
45.43%
DSCR
3.02
1% rule
2.10%
Cash to close
$15,372
Investor read
- This is a 2-bed/1.0-bath manufactured listed at $55k.
- At list price, monthly cash flow is $582 ($7k/yr) — positive.
- The deal already cash-flows at list — no discount required.
- Meets the 1% rule at list price ($1k rent vs $55k).
- Only 7 days on market — expect competitive offers; lowballing is unlikely to land.
- Local home prices are declining (-3.0%/yr); year-one equity from $380 of loan paydown is wiped out by about $2k of value loss. Plan a longer hold.
- Location reads 71/100 on livability (#728 in PA) — a middle-class / working-renter tenant base. Strengths: crime A+, employment A+, housing A+; Watch: cost of living D+, amenities F, commute F.
- Eastern Lancaster County SD (suburban): math 34% / reading 48% proficiency, ranked #321 of 539 in PA (top 60%) — families likely to look elsewhere, expect single-tenant / working-renter base with shorter leases.
- Zoned schools: New Holland Elementary (math 37% / reading 52%, grade F, #815 of 1,518 statewide, top 56%, 523 students, 52% FRL); Garden Spot Ms (math 21% / reading 46%, grade F, #342 of 512 statewide, top 67%, 436 students, 47% FRL); Garden Spot Shs (math 82% / reading 30%, grade C, #90 of 437 statewide, top 21%, 926 students, 39% FRL) — zoned schools average 46% FRL vs 28% district-wide (18 pts higher); higher-poverty schools than district average — tighter screening recommended.
- Market conditions: 43 active listings in the ZIP; 1,093 units permitted in Lancaster County in 2024 (201 in 5+ unit buildings).
- Lancaster County population projected at +5% by 2050 — modest demand growth; plan on rents tracking national, not racing it.
- 3 sale attempts since 6y ago with the ask held roughly flat each time — persistent listings suggest the price (not the market) is what's stuck; bring a comps-based counter.
- Current owner paid $27k; list at $55k implies a 103% gain — meaningful room to come down on a strong offer.
- At projected returns (-3.0% appreciation + 3.0% rent growth), your $15k cash investment doubles in ~3 years — after that, you're playing with house money.
- Climate carrying-cost: moderate wind risk, 24% chance of damaging wind over 30y; extreme-heat days projected 7→15/yr by 2055 (HVAC capex compounding) — expect insurance premiums to compound above CPI over the hold.
Questions for listing agent
- Is there a deadline driving the sale (1031 exchange, divorce, estate, relocation)? That informs how much negotiation room exists.
- Schools are D-rated, which usually means shorter tenancies and higher turnover. Who's the typical renter profile here, and what's been the actual vacancy rate?
- What's the average days-on-market for RENTAL listings here right now (not sales)? A rising rental-DOM trend means longer vacancies and softer asking-rent achievability than the comps imply.
- What's the recent tenant-quality profile in this submarket — average credit score on applications, eviction rate, late-payment / NSF rate, and stable-employment percentage? A property-management company in the area should have these aggregated.
- How much new for-sale + rental construction is in the pipeline within 1–3 miles? Heavy new supply typically softens prices + rents 12–24 months out; constrained supply supports both.
CashFlowRE · CFR-JAY85GBNM7J21P
· Data 4 days ago
cashflowre.app · 2026-05-29