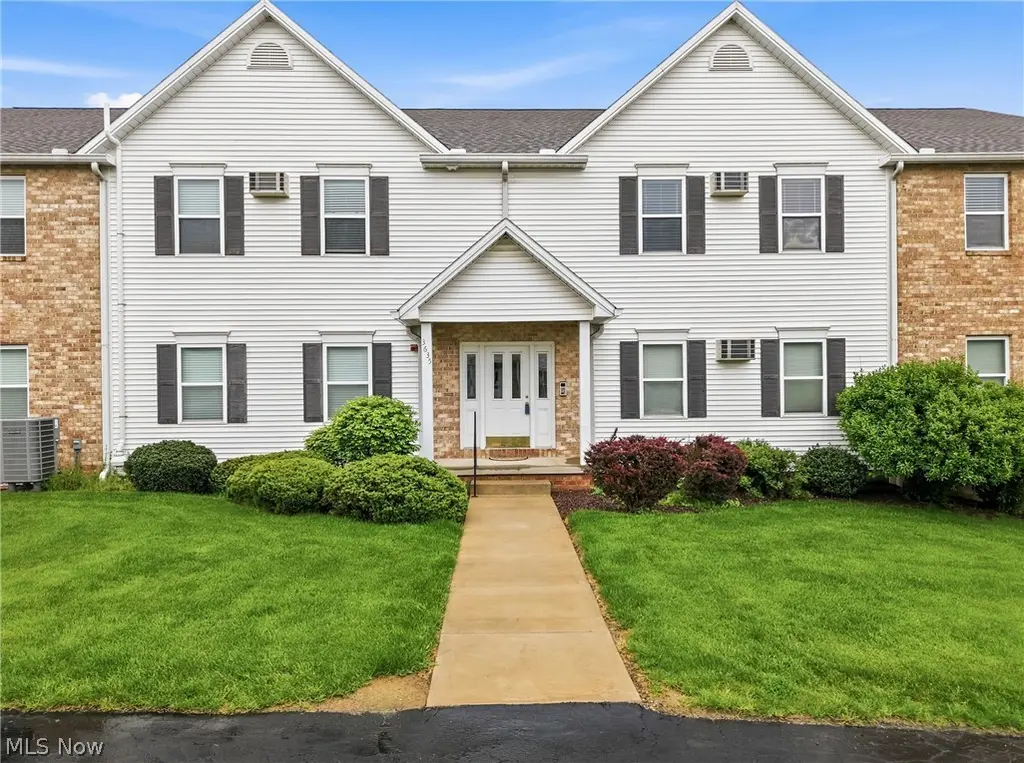
3635 Indian Run Dr #6
Canfield, OH 44406
$120,000D+
2 bd · 1.0 ba ·
1,040 sqft ·
Built 2003
· Condo
· Pending
· 6 DOM
Cashflow @ list (25.0% down · 7.5%)
Estimated rent
$1,211/mo
Mortgage (P&I)
−$629
Tax + insurance
−$184
HOA
−$150
Vac / Maint / Mgmt
−$254
Net cashflow
$-6/mo
Annual
$-77/yr
Cap rate
6.23%
Cash-on-cash
-0.23%
DSCR
0.99
1% rule
1.01%
Cash to close
$33,600
Investor read
- This is a 2-bed/1.0-bath condo listed at $120k.
- At list price, monthly cash flow is $-6 ($-77/yr) — negative.
- To cash-flow at today's rent, offer at most $119k (0.9% below list).
- Meets the 1% rule at list price ($1k rent vs $120k).
- Only 6 days on market — expect competitive offers; lowballing is unlikely to land.
- Recommended offer: $119k (0.9% below list) — sets the bar for cash-flow.
- Local home prices are declining (-3.0%/yr); year-one equity from $830 of loan paydown is wiped out by about $4k of value loss. Plan a longer hold.
- Location reads 88/100 on livability (#25 in OH, #228 nationally) — a professional / high-income tenant draw. Strengths: schools A+, crime A+, employment A+; Watch: amenities F, commute F.
- Canfield Local (suburban): math 84% / reading 80% proficiency, ranked #38 of 656 in OH (top 6%) — strong family-tenant draw, lease renewals of 3-5y typical; only 11% free/reduced lunch — higher-income household profile.
- Market conditions: 123 active listings in the ZIP; 7 comparable units currently listed for rent nearby; rentals leasing fast (median 14d on market — plan ~1-2 weeks tenant-placement turnaround); solid renter incomes; 147 units permitted in Mahoning County in 2024 (0 in 5+ unit buildings).
- Mahoning County population projected at -14% by 2050 — secular population decline; favor cash flow + early exit over multi-decade hold.
- 4 sale attempts since 23y ago with the ask held roughly flat each time — persistent listings suggest the price (not the market) is what's stuck; bring a comps-based counter.
- Cap rate 6.2% vs local median 2.4% in Canfield — top-decile yield for the area; either an underpriced asset or a hidden risk that comps aren't pricing in. Stress-test before assuming the spread holds.
- This rent is only 15% of the median local income ($100k/yr) — well below the 30% rent-burden line; pricing power to push rent on renewal without tenant pushback.
Questions for listing agent
- What do current leases actually rent for vs. the listed asking? Can we see a recent rent roll and the last 12 months of T-12 income?
- What does the HOA fee cover, when was the last increase, and are there any pending special assessments or reserve-fund shortfalls?
- Any open or pending special assessments — roof, HVAC, plumbing, elevator, façade? What's the per-unit balance and payoff schedule, and is the seller paying it off at close or rolling it to the buyer?
- Is there a deadline driving the sale (1031 exchange, divorce, estate, relocation)? That informs how much negotiation room exists.
- Schools are A-rated — typically a magnet for longer-tenancy family renters. What's the average tenant stay here, and is there a school-zone premium baked into asking?
- The area grade is low — what's the realistic commute time and amenity access for the typical tenant pool here? Any planned neighborhood developments (good or bad) we should know about?
- What's the average days-on-market for RENTAL listings here right now (not sales)? A rising rental-DOM trend means longer vacancies and softer asking-rent achievability than the comps imply.
- What's the recent tenant-quality profile in this submarket — average credit score on applications, eviction rate, late-payment / NSF rate, and stable-employment percentage? A property-management company in the area should have these aggregated.
CashFlowRE · CFR-JBNGGV9MS8N3SJ
· Data 3 weeks ago
cashflowre.app · 2026-05-29