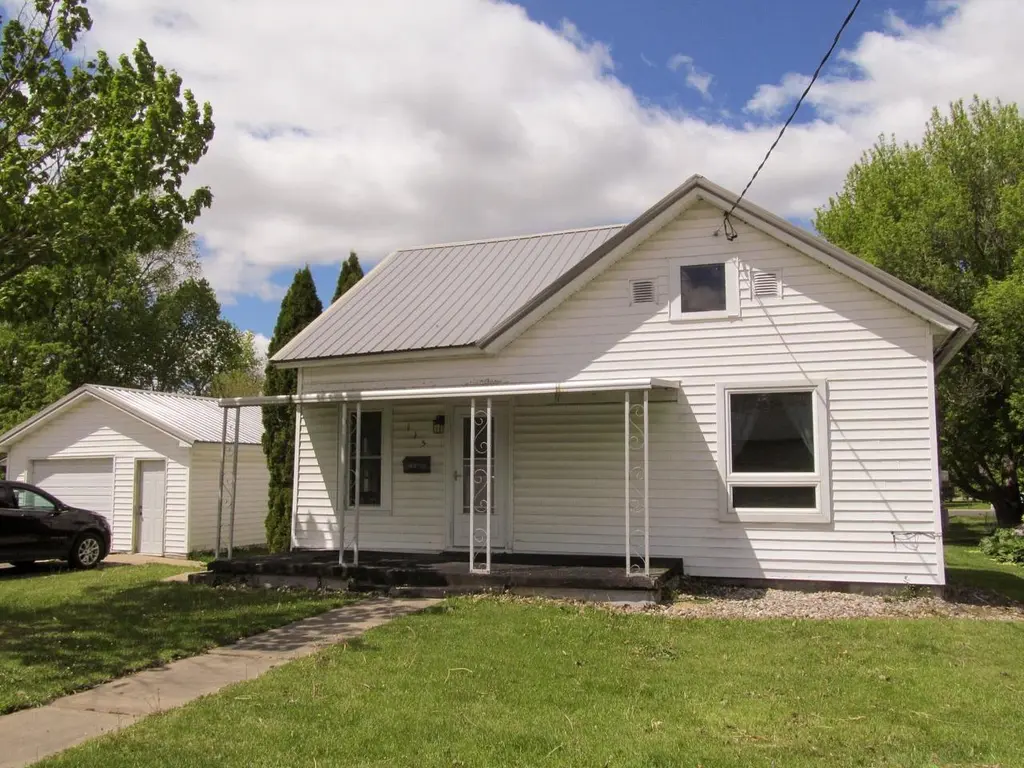
115 S Grand St
Livingston, WI 53554
$125,000C-
2 bd · 1.0 ba ·
1,074 sqft ·
Built 1900
· SingleFamily
· Pending
· 4 DOM
Cashflow @ list (25.0% down · 7.5%)
Estimated rent
$929/mo
Mortgage (P&I)
−$656
Tax + insurance
−$150
HOA
−$0
Vac / Maint / Mgmt
−$195
Net cashflow
$-72/mo
Annual
$-865/yr
Cap rate
5.60%
Cash-on-cash
-2.47%
DSCR
0.89
1% rule
0.74%
Cash to close
$35,000
Investor read
- This is a 2-bed/1.0-bath single-family listed at $125k.
- At list price, monthly cash flow is $-72 ($-865/yr) — negative.
- To cash-flow at today's rent, offer at most $112k (10.2% below list).
- To meet the 1% rule (rent ≥ 1% of price), the offer needs to be $93k (25.7% below list).
- Only 4 days on market — expect competitive offers; lowballing is unlikely to land.
- Recommended offer: $93k (25.7% below list) — sets the bar for 1% rule.
- In year one you build about $10k of equity ($864 loan paydown + $9k appreciation (7.4% local appreciation)).
- Location reads 66/100 on livability (#483 in WI) — a middle-class / working-renter tenant base. Strengths: cost of living A+, housing A+; Watch: health & safety C-, amenities F, commute F.
- Iowa-Grant School District (rural): math 45% / reading 40% proficiency, ranked #125 of 342 in WI (top 36%) — families likely to look elsewhere, expect single-tenant / working-renter base with shorter leases.
- Zoned schools: Iowa-Grant Elementary/Middle (math 49% / reading 42%, grade D-, #363 of 1,041 statewide, top 35%, 473 students, 40% FRL); Iowa-Grant High (math 5% / reading 24%, grade F, #423 of 483 statewide, top 88%, 203 students, 34% FRL).
- Zoned-school proficiency averages 30% at this address vs 42% district-wide (-12 pts) — the specific schools serving this property underperform the Iowa-Grant School District average; the district grade overstates school quality for this exact location.
- Watch-outs: built in 1900 — expect roof / HVAC / electrical / plumbing capex.
- Market conditions: 1 active listings in the ZIP; 120 units permitted in Grant County in 2024 (0 in 5+ unit buildings).
- Grant County population projected at +10% by 2050 — modest demand growth; plan on rents tracking national, not racing it.
- At projected returns (7.4% appreciation + 3.0% rent growth), your $35k cash investment doubles in ~4 years — after that, you're playing with house money.
- By year 4, paydown + projected appreciation supports a ~$35k cash-out refi (75% LTV) — recoverable capital for the next deal without selling this one.
Questions for listing agent
- What do current leases actually rent for vs. the listed asking? Can we see a recent rent roll and the last 12 months of T-12 income?
- Built in 1900 — when were the roof, HVAC, electrical panel, plumbing, and water heater last replaced?
- Is there a deadline driving the sale (1031 exchange, divorce, estate, relocation)? That informs how much negotiation room exists.
- Schools are D-rated, which usually means shorter tenancies and higher turnover. Who's the typical renter profile here, and what's been the actual vacancy rate?
- What's the average days-on-market for RENTAL listings here right now (not sales)? A rising rental-DOM trend means longer vacancies and softer asking-rent achievability than the comps imply.
- What's the recent tenant-quality profile in this submarket — average credit score on applications, eviction rate, late-payment / NSF rate, and stable-employment percentage? A property-management company in the area should have these aggregated.
- How much new for-sale + rental construction is in the pipeline within 1–3 miles? Heavy new supply typically softens prices + rents 12–24 months out; constrained supply supports both.
CashFlowRE · CFR-JEXB9T9HHQHA4B
· Data 4 weeks ago
cashflowre.app · 2026-05-29