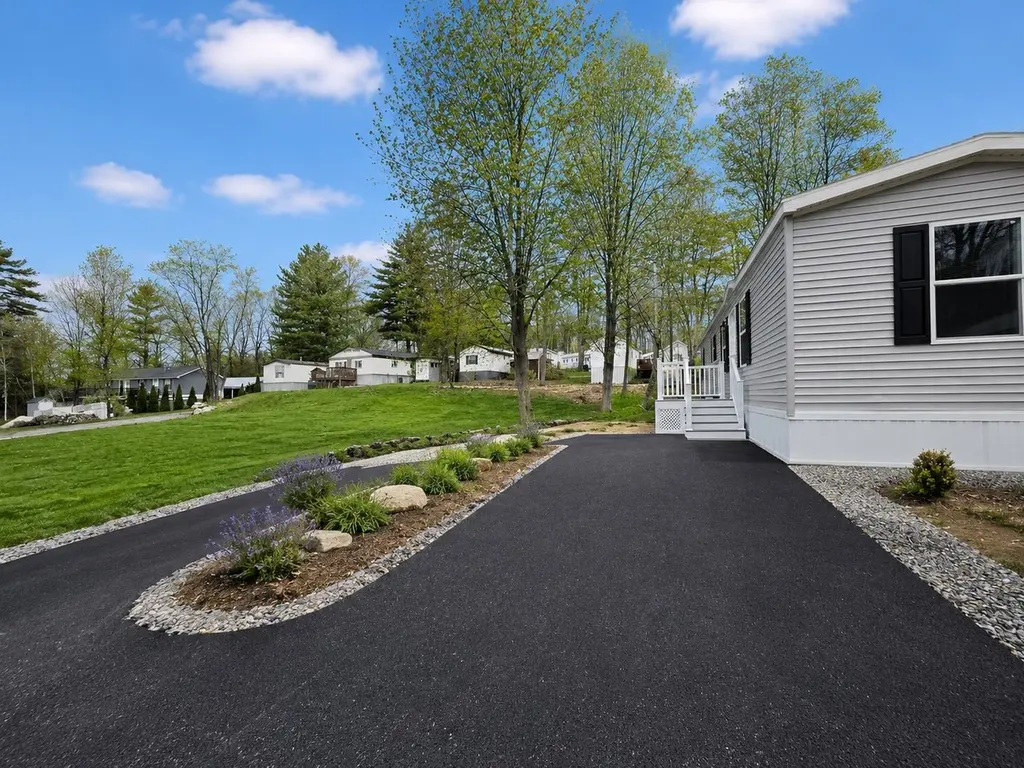
9 Sargent Pl #6
Laconia, NH 03249
$159,900D+
2 bd · 1.0 ba ·
696 sqft ·
Built 2026
· Manufactured
· Active
· 26 DOM
Cashflow @ list (25.0% down · 7.5%)
Estimated rent
$1,650/mo
Mortgage (P&I)
−$839
Tax + insurance
−$117
HOA
−$525
Vac / Maint / Mgmt
−$346
Net cashflow
$-177/mo
Annual
$-2,128/yr
Cap rate
4.96%
Cash-on-cash
-4.75%
DSCR
0.79
1% rule
1.03%
Cash to close
$44,772
Investor read
- This is a 2-bed/1.0-bath manufactured listed at $160k.
- At list price, monthly cash flow is $-177 ($-2k/yr) — negative.
- To cash-flow at today's rent, offer at most $129k (19.6% below list).
- Meets the 1% rule at list price ($2k rent vs $160k).
- It's been on market 26 days — a 2% lower offer ($158k) is reasonable based on typical stale-listing flexibility.
- Recommended offer: $129k (19.6% below list) — sets the bar for cash-flow.
- In year one you build about $17k of equity ($1k loan paydown + $16k appreciation (10.0% local appreciation)).
- Location reads 79/100 on livability (#20 in NH, #2,314 nationally) — a middle-class / working-renter tenant base. Strengths: cost of living A+, housing A+, health & safety A+; Watch: commute F.
- Gilford School District (rural): math 52% / reading 52% proficiency, ranked #32 of 98 in NH (top 33%) — acceptable for families but not a draw, mixed tenant base, ~2y average lease; only 17% free/reduced lunch — higher-income household profile.
- Zoned schools: Gilford Elementary School (math 57% / reading 62%, grade B-, #42 of 263 statewide, top 19%, 322 students, 13% FRL); Gilford Middle School (math 55% / reading 49%, grade C+, #18 of 96 statewide, top 19%, 305 students, 18% FRL); Gilford High School (math 37% / reading 52%, grade F, #54 of 90 statewide, top 61%, 499 students, 14% FRL) — zoned schools at 15% FRL track the district average.
- Watch-outs: HOA is 32% of rent.
- Market conditions: 87 active listings in the ZIP; 1 comparable units currently listed for rent nearby; 301 units permitted in Belknap County in 2024 (32 in 5+ unit buildings).
- Belknap County population projected at -10% by 2050 — secular population decline; favor cash flow + early exit over multi-decade hold.
- By year 3, paydown + projected appreciation supports a ~$43k cash-out refi (75% LTV) — recoverable capital for the next deal without selling this one.
- Cap rate 5.0% vs local median 1.8% in Laconia — top-decile yield for the area; either an underpriced asset or a hidden risk that comps aren't pricing in. Stress-test before assuming the spread holds.
Questions for listing agent
- What do current leases actually rent for vs. the listed asking? Can we see a recent rent roll and the last 12 months of T-12 income?
- What does the HOA fee cover, when was the last increase, and are there any pending special assessments or reserve-fund shortfalls?
- Is there a deadline driving the sale (1031 exchange, divorce, estate, relocation)? That informs how much negotiation room exists.
- Schools are D-rated, which usually means shorter tenancies and higher turnover. Who's the typical renter profile here, and what's been the actual vacancy rate?
- The area grade is low — what's the realistic commute time and amenity access for the typical tenant pool here? Any planned neighborhood developments (good or bad) we should know about?
- What's the average days-on-market for RENTAL listings here right now (not sales)? A rising rental-DOM trend means longer vacancies and softer asking-rent achievability than the comps imply.
- What's the recent tenant-quality profile in this submarket — average credit score on applications, eviction rate, late-payment / NSF rate, and stable-employment percentage? A property-management company in the area should have these aggregated.
- How much new for-sale + rental construction is in the pipeline within 1–3 miles? Heavy new supply typically softens prices + rents 12–24 months out; constrained supply supports both.
CashFlowRE · CFR-JGH24Q5R5JV94P
· Data 3 weeks ago
cashflowre.app · 2026-05-29