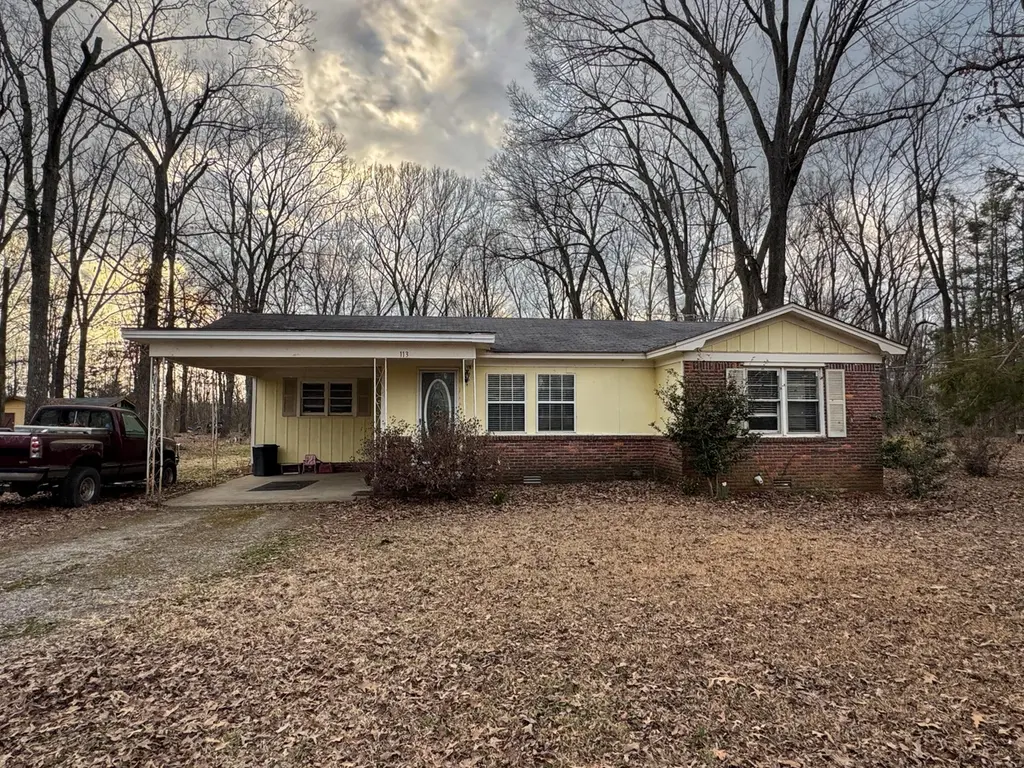
113 Hickory Dr
New Albany, MS 38652
$139,900D+
2 bd · 1.0 ba ·
992 sqft ·
Built 1970
· SingleFamily
· Pending
· 43 DOM
Cashflow @ list (25.0% down · 7.5%)
Estimated rent
$1,086/mo
Mortgage (P&I)
−$734
Tax + insurance
−$124
HOA
−$0
Vac / Maint / Mgmt
−$228
Net cashflow
$0/mo
Annual
$1/yr
Cap rate
6.29%
Cash-on-cash
0.00%
DSCR
1.00
1% rule
0.78%
Cash to close
$39,172
Investor read
- This is a 2-bed/1.0-bath single-family listed at $140k.
- At list price, monthly cash flow is $0 ($1/yr) — positive.
- The deal already cash-flows at list — no discount required.
- To meet the 1% rule (rent ≥ 1% of price), the offer needs to be $109k (22.4% below list).
- It's been on market 43 days — a 3% lower offer ($136k) is reasonable based on typical stale-listing flexibility.
- Recommended offer: $109k (22.4% below list) — sets the bar for 1% rule.
- Local home prices are declining (-3.0%/yr); year-one equity from $967 of loan paydown is wiped out by about $4k of value loss. Plan a longer hold.
- Location reads 74/100 on livability (#13 in MS, #4,449 nationally) — a middle-class / working-renter tenant base. Strengths: crime A+, cost of living A+, health & safety A-; Watch: employment D+, amenities F, commute F.
- New Albany Public Schools (rural): math 51% / reading 43% proficiency, ranked #22 of 130 in MS (top 17%) — families likely to look elsewhere, expect single-tenant / working-renter base with shorter leases.
- Zoned schools: New Albany Elementary School (math 51% / reading 48%, grade D, #65 of 375 statewide, top 20%, 1,048 students, 100% FRL); New Albany Middle School (math 47% / reading 35%, grade F, #56 of 179 statewide, top 33%, 482 students, 99% FRL); New Albany High School (math 67% / reading 57%, grade B-, #5 of 197 statewide, top 3%, 584 students, 100% FRL) — zoned schools average 100% FRL vs 58% district-wide (42 pts higher); higher-poverty schools than district average — tighter screening recommended.
- Market conditions: 157 active listings in the ZIP; 17 units permitted in Union County in 2024 (0 in 5+ unit buildings).
- Union County population projected at +19% by 2050 — long-run rental-demand tailwind backs the buy-and-hold thesis.
- 3 sale attempts with the ask held roughly flat each time — persistent listings suggest the price (not the market) is what's stuck; bring a comps-based counter.
- Climate carrying-cost: moderate wind risk, 26% chance of damaging wind over 30y; extreme-heat days projected 7→20/yr by 2055 (HVAC capex compounding) — expect insurance premiums to compound above CPI over the hold.
Questions for listing agent
- It's been on market 43 days. Have you received any prior offers? Is the seller open to a 22% concession, seller financing, or rate buy-down credit?
- Built in 1970 — when were the roof, HVAC, electrical panel, plumbing, and water heater last replaced?
- Is there a deadline driving the sale (1031 exchange, divorce, estate, relocation)? That informs how much negotiation room exists.
- The area grade is low — what's the realistic commute time and amenity access for the typical tenant pool here? Any planned neighborhood developments (good or bad) we should know about?
- What's the average days-on-market for RENTAL listings here right now (not sales)? A rising rental-DOM trend means longer vacancies and softer asking-rent achievability than the comps imply.
- What's the recent tenant-quality profile in this submarket — average credit score on applications, eviction rate, late-payment / NSF rate, and stable-employment percentage? A property-management company in the area should have these aggregated.
- How much new for-sale + rental construction is in the pipeline within 1–3 miles? Heavy new supply typically softens prices + rents 12–24 months out; constrained supply supports both.
CashFlowRE · CFR-JGJ5BQ2AAE38Y9
· Data 1 week ago
cashflowre.app · 2026-05-29