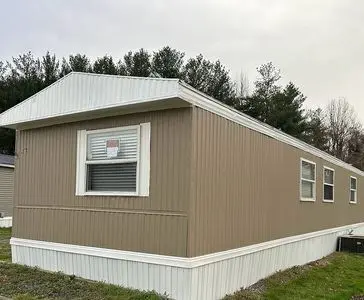
200 Beechwood Ave
Kent Acres, DE 19901
$43,000B-
3 bd · 2.0 ba ·
1,064 sqft ·
Built 1986
· Manufactured
· Active
· 14 DOM
Cashflow @ list (25.0% down · 7.5%)
Estimated rent
$1,403/mo
Mortgage (P&I)
−$225
Tax + insurance
−$36
HOA
−$0
Vac / Maint / Mgmt
−$295
Net cashflow
$847/mo
Annual
$10,163/yr
Cap rate
29.93%
Cash-on-cash
84.41%
DSCR
4.76
1% rule
3.26%
Cash to close
$12,040
Investor read
- This is a 3-bed/2.0-bath manufactured listed at $43k.
- At list price, monthly cash flow is $847 ($10k/yr) — positive.
- The deal already cash-flows at list — no discount required.
- Meets the 1% rule at list price ($1k rent vs $43k).
- Only 14 days on market — expect competitive offers; lowballing is unlikely to land.
- Local home prices are declining (-3.0%/yr); year-one equity from $297 of loan paydown is wiped out by about $1k of value loss. Plan a longer hold.
- Location reads 66/100 on livability (#41 in DE) — a middle-class / working-renter tenant base. Strengths: crime A+, cost of living A+, health & safety B; Watch: amenities F, commute F, employment D-.
- Caesar Rodney School District (suburban): math 26% / reading 49% proficiency, ranked #9 of 26 in DE (top 35%) — families likely to look elsewhere, expect single-tenant / working-renter base with shorter leases.
- Zoned schools: W. Reily Brown Elementary School (math 17% / reading 35%, grade F, #65 of 105 statewide, top 62%, 540 students, 0% FRL); Fred Fifer Iii Middle School (math 25% / reading 51%, grade F, #8 of 36 statewide, top 20%, 679 students, 0% FRL); Caesar Rodney High School (math 31% / reading 61%, grade D-, #7 of 40 statewide, top 15%, 2,257 students, 0% FRL) — zoned schools average 0% FRL vs 35% district-wide (35 pts lower); this property's tenant base skews higher-income than the district average.
- Market conditions: Rents rising (+2.0%/yr); 190 active listings in the ZIP; 5 comparable units currently listed for rent nearby; rentals lingering (median 46d on market — plan ~5-8 weeks vacancy on turnover, expect pricing pressure); 100% of comp listings sitting > 30 days — soft ceiling on asking rent; 1,201 units permitted in Kent County in 2024 (116 in 5+ unit buildings).
- Kent County population projected at +22% by 2050 — long-run rental-demand tailwind backs the buy-and-hold thesis.
- At projected returns (-3.0% appreciation + 2.0% rent growth), your $12k cash investment doubles in ~2 years — after that, you're playing with house money.
Questions for listing agent
- Is there a deadline driving the sale (1031 exchange, divorce, estate, relocation)? That informs how much negotiation room exists.
- Schools are F-rated, which usually means shorter tenancies and higher turnover. Who's the typical renter profile here, and what's been the actual vacancy rate?
- What's the average days-on-market for RENTAL listings here right now (not sales)? A rising rental-DOM trend means longer vacancies and softer asking-rent achievability than the comps imply.
- What's the recent tenant-quality profile in this submarket — average credit score on applications, eviction rate, late-payment / NSF rate, and stable-employment percentage? A property-management company in the area should have these aggregated.
- How much new for-sale + rental construction is in the pipeline within 1–3 miles? Heavy new supply typically softens prices + rents 12–24 months out; constrained supply supports both.
CashFlowRE · CFR-JKHCH0EDXMDXN1
· Data 1 day ago
cashflowre.app · 2026-05-29