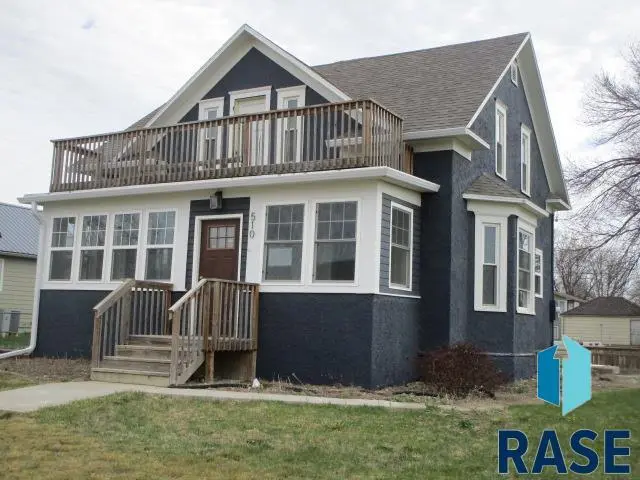
510 Main St St
Chancellor, SD 57015
$155,000D
3 bd · 1.0 ba ·
728 sqft ·
Built 1922
· SingleFamily
· Pending
· 28 DOM
Cashflow @ list (25.0% down · 7.5%)
Estimated rent
$951/mo
Mortgage (P&I)
−$813
Tax + insurance
−$167
HOA
−$0
Vac / Maint / Mgmt
−$200
Net cashflow
$-228/mo
Annual
$-2,737/yr
Cap rate
4.53%
Cash-on-cash
-6.31%
DSCR
0.72
1% rule
0.61%
Cash to close
$43,400
Investor read
- This is a 3-bed/1.0-bath single-family listed at $155k.
- At list price, monthly cash flow is $-228 ($-3k/yr) — negative.
- To cash-flow at today's rent, offer at most $115k (26.0% below list).
- To meet the 1% rule (rent ≥ 1% of price), the offer needs to be $95k (38.6% below list).
- It's been on market 28 days — a 2% lower offer ($153k) is reasonable based on typical stale-listing flexibility.
- Recommended offer: $95k (38.6% below list) — sets the bar for 1% rule.
- In year one you build about $903 of equity ($1k loan paydown + $-169 appreciation (-0.1% local appreciation)).
- Location reads 63/100 on livability (#205 in SD) — a middle-class / working-renter tenant base. Strengths: cost of living A+, housing A+; Watch: crime D+, amenities F, commute F.
- Lennox School District 41-4 (rural): math 56% / reading 64% proficiency, ranked #5 of 59 in SD (top 8%) — acceptable for families but not a draw, mixed tenant base, ~2y average lease; only 12% free/reduced lunch — higher-income household profile.
- Zoned schools: Lennox Elementary - 02 (math 72% / reading 67%, grade A-, #19 of 253 statewide, top 12%, 369 students, 16% FRL); Lennox Jr. High - 08 (math 57% / reading 67%, grade B+, #13 of 143 statewide, top 11%, 189 students, 15% FRL); Lennox High School - 01 (math 32% / reading 77%, grade C-, #53 of 151 statewide, top 41%, 359 students, 14% FRL) — zoned schools at 15% FRL track the district average.
- Watch-outs: built in 1922 — expect roof / HVAC / electrical / plumbing capex.
- Market conditions: 8 active listings in the ZIP; 29 units permitted in Turner County in 2024 (0 in 5+ unit buildings).
- Turner County population projected at -13% by 2050 — secular population decline; favor cash flow + early exit over multi-decade hold.
- 2 sale attempts since 4y ago with the ask held roughly flat each time — persistent listings suggest the price (not the market) is what's stuck; bring a comps-based counter.
Questions for listing agent
- What do current leases actually rent for vs. the listed asking? Can we see a recent rent roll and the last 12 months of T-12 income?
- Built in 1922 — when were the roof, HVAC, electrical panel, plumbing, and water heater last replaced?
- Is there a deadline driving the sale (1031 exchange, divorce, estate, relocation)? That informs how much negotiation room exists.
- Schools are D-rated, which usually means shorter tenancies and higher turnover. Who's the typical renter profile here, and what's been the actual vacancy rate?
- Crime grade is D in this area — have there been break-ins, vandalism, or insurance claims at this property in the last 3 years? What carrier currently insures it and at what premium?
- The area grade is low — what's the realistic commute time and amenity access for the typical tenant pool here? Any planned neighborhood developments (good or bad) we should know about?
- What's the average days-on-market for RENTAL listings here right now (not sales)? A rising rental-DOM trend means longer vacancies and softer asking-rent achievability than the comps imply.
- What's the recent tenant-quality profile in this submarket — average credit score on applications, eviction rate, late-payment / NSF rate, and stable-employment percentage? A property-management company in the area should have these aggregated.
CashFlowRE · CFR-JKVYGVB1MJ0WBK
· Data 4 weeks ago
cashflowre.app · 2026-05-29