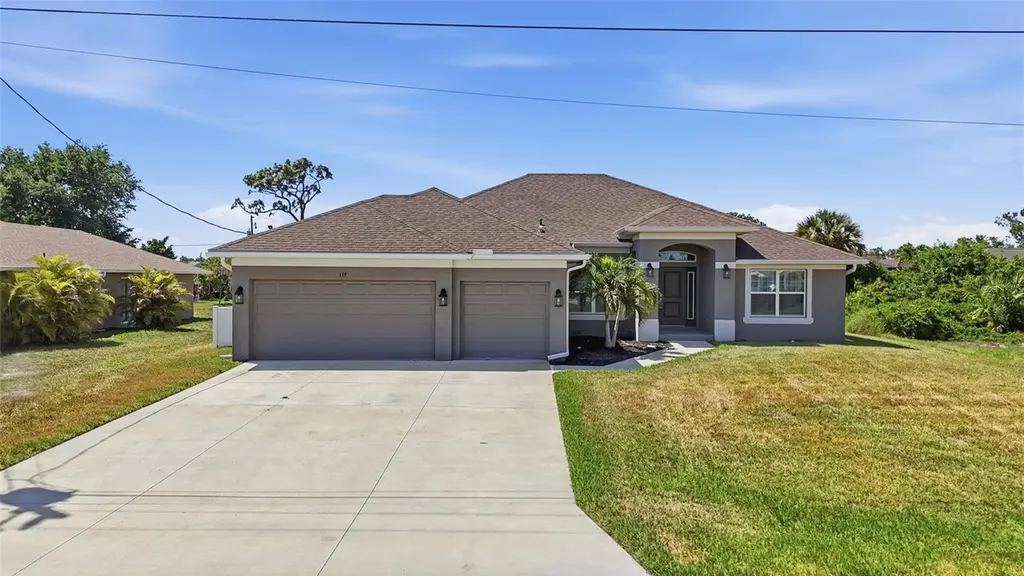
119 Long Meadow Ln
Rotonda, FL 33947
$375,000D
4 bd · 3.0 ba ·
2,235 sqft ·
Built 2023
· Land
· Active
· 36 DOM
Cashflow @ list (25.0% down · 7.5%)
Estimated rent
$3,055/mo
Mortgage (P&I)
−$1,967
Tax + insurance
−$736
HOA
−$15
Vac / Maint / Mgmt
−$642
Net cashflow
$-304/mo
Annual
$-3,651/yr
Cap rate
5.53%
Cash-on-cash
-2.72%
DSCR
0.88
1% rule
0.81%
Cash to close
$105,000
Investor read
- This is a 4-bed/3.0-bath land listed at $375k.
- At list price, monthly cash flow is $-304 ($-4k/yr) — negative.
- To cash-flow at today's rent, offer at most $321k (14.3% below list).
- To meet the 1% rule (rent ≥ 1% of price), the offer needs to be $306k (18.5% below list).
- It's been on market 36 days — a 3% lower offer ($364k) is reasonable based on typical stale-listing flexibility.
- Recommended offer: $306k (18.5% below list) — sets the bar for 1% rule.
- In year one you build about $7k of equity ($3k loan paydown + $5k appreciation (1.2% local appreciation)).
- Location reads 67/100 on livability (#548 in FL) — a middle-class / working-renter tenant base. Strengths: crime A+, housing A-, cost of living B+; Watch: schools D, amenities F, commute F.
- Charlotte (suburban): math 54% / reading 54% proficiency, ranked #22 of 73 in FL (top 30%) — acceptable for families but not a draw, mixed tenant base, ~2y average lease.
- Watch-outs: flood insurance adds $66/mo.
- Market conditions: Rents soft (-0.2%/yr); 863 active listings in the ZIP; 25 comparable units currently listed for rent nearby; rentals at typical pace (median 21d on market — plan ~3-4 weeks tenant-placement turnaround); solid renter incomes; 4,585 units permitted in Charlotte County in 2024 (703 in 5+ unit buildings).
- Charlotte County population projected at +24% by 2050 — long-run rental-demand tailwind backs the buy-and-hold thesis.
- 5 sale attempts since 16y ago with the ask held roughly flat each time — persistent listings suggest the price (not the market) is what's stuck; bring a comps-based counter.
- By year 5, paydown + projected appreciation supports a ~$33k cash-out refi (75% LTV) — recoverable capital for the next deal without selling this one.
- Climate carrying-cost: severe flood risk; severe wind risk, 99% chance of damaging wind over 30y; extreme-heat days projected 7→27/yr by 2055 (HVAC capex compounding) — expect insurance premiums to compound above CPI over the hold.
- Cap rate 5.5% vs local median 3.1% in Rotonda — top-decile yield for the area; either an underpriced asset or a hidden risk that comps aren't pricing in. Stress-test before assuming the spread holds.
- At $3,055/mo this rent would consume 46% of the median local household income ($80k/yr) (locally 91% of renters already pay >50% of income on rent) — very limited rent-growth headroom before tenants either downsize or default.
Questions for listing agent
- What do current leases actually rent for vs. the listed asking? Can we see a recent rent roll and the last 12 months of T-12 income?
- It's been on market 36 days. Have you received any prior offers? Is the seller open to a 19% concession, seller financing, or rate buy-down credit?
- What's the actual annual flood-insurance premium (NFIP or private), and is the property in a SFHA with mandatory coverage?
- What does the HOA fee cover, when was the last increase, and are there any pending special assessments or reserve-fund shortfalls?
- Is there a deadline driving the sale (1031 exchange, divorce, estate, relocation)? That informs how much negotiation room exists.
- Schools are D-rated, which usually means shorter tenancies and higher turnover. Who's the typical renter profile here, and what's been the actual vacancy rate?
- The area grade is low — what's the realistic commute time and amenity access for the typical tenant pool here? Any planned neighborhood developments (good or bad) we should know about?
- What's the average days-on-market for RENTAL listings here right now (not sales)? A rising rental-DOM trend means longer vacancies and softer asking-rent achievability than the comps imply.
CashFlowRE · CFR-JS2B5X1ZTZDPSR
· Data 2 days ago
cashflowre.app · 2026-05-29