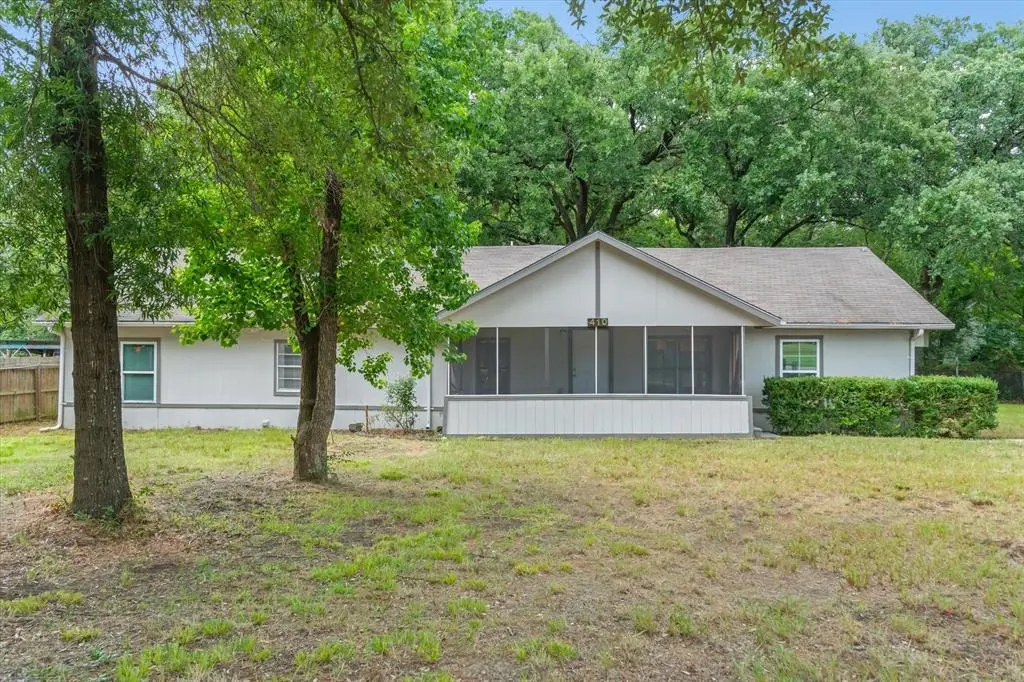
410 Pleasure Land Rd
Gun Barrel City, TX 75156
$204,900C-
3 bd · 3.0 ba ·
2,144 sqft ·
Built 1976
· SingleFamily
· Active
· 324 DOM
Cashflow @ list (25.0% down · 7.5%)
Estimated rent
$1,943/mo
Mortgage (P&I)
−$1,075
Tax + insurance
−$264
HOA
−$0
Vac / Maint / Mgmt
−$408
Net cashflow
$196/mo
Annual
$2,353/yr
Cap rate
7.44%
Cash-on-cash
4.10%
DSCR
1.18
1% rule
0.95%
Cash to close
$57,372
Investor read
- This is a 3-bed/3.0-bath single-family listed at $205k.
- At list price, monthly cash flow is $196 ($2k/yr) — positive.
- The deal already cash-flows at list — no discount required.
- To meet the 1% rule (rent ≥ 1% of price), the offer needs to be $194k (5.2% below list).
- It's been on market 324 days — a 12% lower offer ($180k) is reasonable based on typical stale-listing flexibility.
- Recommended offer: $180k (12.0% below list) — sets the bar for market timing.
- Local home prices are declining (-3.0%/yr); year-one equity from $1k of loan paydown is wiped out by about $6k of value loss. Plan a longer hold.
- Location reads 67/100 on livability (#519 in TX) — a middle-class / working-renter tenant base. Strengths: cost of living A+, housing A+, health & safety B+; Watch: employment D+, amenities F, commute F.
- Mabank ISD (town): math 47% / reading 44% proficiency, ranked #273 of 826 in TX (top 33%) — families likely to look elsewhere, expect single-tenant / working-renter base with shorter leases.
- Market conditions: Rents falling (-5.8%/yr); 694 active listings in the ZIP; 5 comparable units currently listed for rent nearby; rentals lingering (median 45d on market — plan ~5-8 weeks vacancy on turnover, expect pricing pressure); 100% of comp listings sitting > 30 days — soft ceiling on asking rent; 263 units permitted in Henderson County in 2024 (0 in 5+ unit buildings).
- 16 sale attempts since 20y ago; this cycle's ask is 12706% above the opening price — seller raised mid-cycle; expect resistance to lowballs.
- Current owner paid $30k; list at $205k implies a 583% gain — meaningful room to come down on a strong offer.
- Cap rate 7.4% vs local median 3.3% in Gun Barrel City — top-decile yield for the area; either an underpriced asset or a hidden risk that comps aren't pricing in. Stress-test before assuming the spread holds.
- This rent runs 38% of the median local income ($61k/yr) — at the standard rent-burdened threshold; future hikes will face affordability resistance.
Questions for listing agent
- It's been on market 324 days. Have you received any prior offers? Is the seller open to a 12% concession, seller financing, or rate buy-down credit?
- Built in 1976 — when were the roof, HVAC, electrical panel, plumbing, and water heater last replaced?
- Why hasn't it sold? Are there any deal-killer items the seller is aware of (foundation, flood, title, zoning, code violations)?
- Is there a deadline driving the sale (1031 exchange, divorce, estate, relocation)? That informs how much negotiation room exists.
- What's the average days-on-market for RENTAL listings here right now (not sales)? A rising rental-DOM trend means longer vacancies and softer asking-rent achievability than the comps imply.
- What's the recent tenant-quality profile in this submarket — average credit score on applications, eviction rate, late-payment / NSF rate, and stable-employment percentage? A property-management company in the area should have these aggregated.
- How much new for-sale + rental construction is in the pipeline within 1–3 miles? Heavy new supply typically softens prices + rents 12–24 months out; constrained supply supports both.
CashFlowRE · CFR-JSJEFA3KVTMWDM
· Data 3 weeks ago
cashflowre.app · 2026-05-29