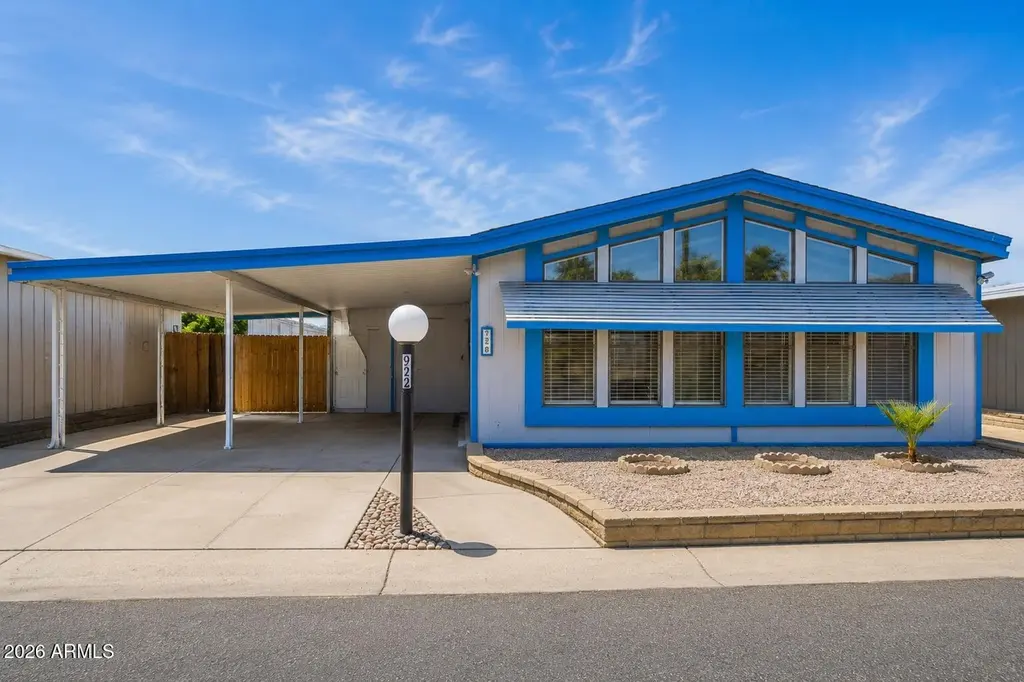
10951 N 91st Ave #92
Peoria, AZ 85345
$127,900C+
2 bd · 2.0 ba ·
1,440 sqft ·
Built 1983
· Manufactured
· Active
· 14 DOM
Cashflow @ list (25.0% down · 7.5%)
Estimated rent
$1,847/mo
Mortgage (P&I)
−$671
Tax + insurance
−$213
HOA
−$0
Vac / Maint / Mgmt
−$388
Net cashflow
$575/mo
Annual
$6,904/yr
Cap rate
11.69%
Cash-on-cash
19.28%
DSCR
1.86
1% rule
1.44%
Cash to close
$35,812
Investor read
- This is a 2-bed/2.0-bath manufactured listed at $128k.
- At list price, monthly cash flow is $575 ($7k/yr) — positive.
- The deal already cash-flows at list — no discount required.
- Meets the 1% rule at list price ($2k rent vs $128k).
- Only 14 days on market — expect competitive offers; lowballing is unlikely to land.
- Local home prices are declining (-3.0%/yr); year-one equity from $884 of loan paydown is wiped out by about $4k of value loss. Plan a longer hold.
- Location reads 76/100 on livability (#14 in AZ, #3,603 nationally) — a middle-class / working-renter tenant base. Strengths: housing A+, commute A, employment A; Watch: cost of living C-, amenities D, health & safety F.
- Peoria Unified School District (4237) (suburban): math 36% / reading 42% proficiency, ranked #64 of 249 in AZ (top 26%) — families likely to look elsewhere, expect single-tenant / working-renter base with shorter leases.
- Zoned schools: Peoria Elementary School (math 21% / reading 29%, grade F, #638 of 1,109 statewide, top 58%, 554 students, 68% FRL); Peoria High School (math 18% / reading 22%, grade F, #225 of 381 statewide, top 60%, 1,566 students, 54% FRL) — zoned schools average 61% FRL vs 35% district-wide (26 pts higher); higher-poverty schools than district average — tighter screening recommended.
- Zoned-school proficiency averages 22% at this address vs 39% district-wide (-16 pts) — the specific schools serving this property underperform the Peoria Unified School District (4237) average; the district grade overstates school quality for this exact location.
- Market conditions: Rents flat; 333 active listings in the ZIP; 40 comparable units currently listed for rent nearby; rentals at typical pace (median 25d on market — plan ~3-4 weeks tenant-placement turnaround); 36,011 units permitted in Maricopa County in 2024 (12,801 in 5+ unit buildings).
- Maricopa County population projected at +38% by 2050 — long-run rental-demand tailwind backs the buy-and-hold thesis.
- 4 sale attempts since 4y ago with the ask held roughly flat each time — persistent listings suggest the price (not the market) is what's stuck; bring a comps-based counter.
- Current owner paid $80k; list at $128k implies a 60% gain — meaningful room to come down on a strong offer.
- At projected returns (-3.0% appreciation + 0.6% rent growth), your $36k cash investment doubles in ~8 years — after that, you're playing with house money.
- Climate carrying-cost: extreme-heat days projected 7→19/yr by 2055 (HVAC capex compounding) — expect insurance premiums to compound above CPI over the hold.
- Cap rate 11.7% vs local median 3.3% in Peoria — top-decile yield for the area; either an underpriced asset or a hidden risk that comps aren't pricing in. Stress-test before assuming the spread holds.
- This rent runs 33% of the median local income ($67k/yr) — at the standard rent-burdened threshold; future hikes will face affordability resistance.
Questions for listing agent
- Is there a deadline driving the sale (1031 exchange, divorce, estate, relocation)? That informs how much negotiation room exists.
- Schools are B-rated — typically a magnet for longer-tenancy family renters. What's the average tenant stay here, and is there a school-zone premium baked into asking?
- What's the average days-on-market for RENTAL listings here right now (not sales)? A rising rental-DOM trend means longer vacancies and softer asking-rent achievability than the comps imply.
- What's the recent tenant-quality profile in this submarket — average credit score on applications, eviction rate, late-payment / NSF rate, and stable-employment percentage? A property-management company in the area should have these aggregated.
- How much new for-sale + rental construction is in the pipeline within 1–3 miles? Heavy new supply typically softens prices + rents 12–24 months out; constrained supply supports both.
CashFlowRE · CFR-K0FEAS3GPZJ22C
· Data 2 days ago
cashflowre.app · 2026-05-29