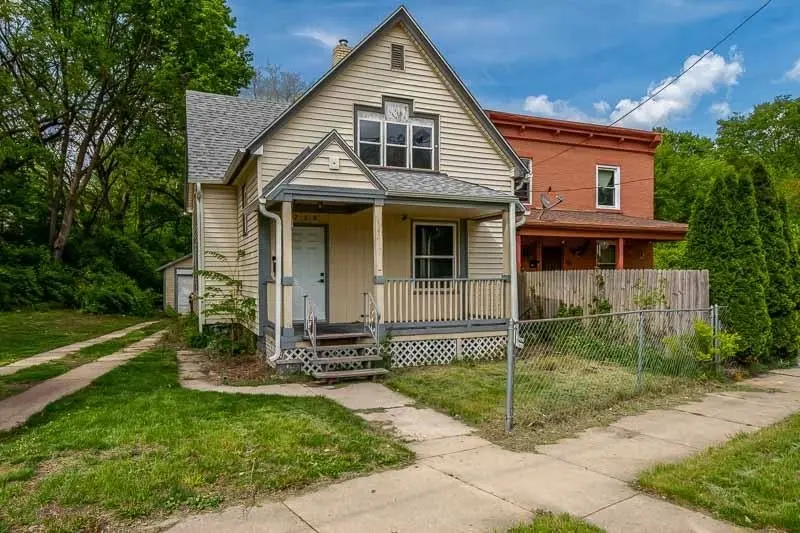
728 10th Ave
Rockford, IL 61104
$99,000B
3 bd · 1.0 ba ·
1,323 sqft ·
Built 1920
· SingleFamily
· Pending
· 3 DOM
Cashflow @ list (25.0% down · 7.5%)
Estimated rent
$1,344/mo
Mortgage (P&I)
−$519
Tax + insurance
−$590
HOA
−$0
Vac / Maint / Mgmt
−$282
Net cashflow
$-47/mo
Annual
$-561/yr
Cap rate
11.31%
Cash-on-cash
17.91%
DSCR
1.80
1% rule
1.36%
Cash to close
$27,720
Investor read
- This is a 3-bed/1.0-bath single-family listed at $99k.
- At list price, monthly cash flow is $-47 ($-561/yr) — negative.
- To cash-flow at today's rent, offer at most $91k (8.3% below list).
- Meets the 1% rule at list price ($1k rent vs $99k).
- Only 3 days on market — expect competitive offers; lowballing is unlikely to land.
- Recommended offer: $91k (8.3% below list) — sets the bar for cash-flow.
- Local home prices are declining (-3.0%/yr); year-one equity from $684 of loan paydown is wiped out by about $3k of value loss. Plan a longer hold.
- Location reads 62/100 on livability (#876 in IL) — a middle-class / working-renter tenant base. Strengths: cost of living A+, housing A+, health & safety A+; Watch: crime F, amenities F, commute F.
- Rockford SD 205 (urban): math 12% / reading 16% proficiency, ranked #533 of 620 in IL (top 86%) — low school quality limits family demand, transient renter base, plan for 1-2y turnover; 73% free/reduced lunch — lower-income household profile, screen leases tightly.
- Zoned schools: Constance Lane Elementary School (math 2% / reading 2%, grade F, #1,927 of 2,056 statewide, top 100%, 573 students, 0% FRL); Abraham Lincoln Middle School (math 3% / reading 7%, grade F, #636 of 665 statewide, top 98%, 699 students, 0% FRL); Rockford East High School (math 7% / reading 13%, grade F, #528 of 693 statewide, top 82%, 1,718 students, 0% FRL) — zoned schools average 0% FRL vs 73% district-wide (73 pts lower); this property's tenant base skews higher-income than the district average.
- Watch-outs: flood insurance adds $460/mo; built in 1920 — expect roof / HVAC / electrical / plumbing capex.
- Market conditions: Rents rising fast (+9.7%/yr); 69 active listings in the ZIP; 23 comparable units currently listed for rent nearby; rentals lingering (median 46d on market — plan ~5-8 weeks vacancy on turnover, expect pricing pressure); 70% of comp listings sitting > 30 days — soft ceiling on asking rent; lower-income renter base — watch delinquency; 285 units permitted in Winnebago County in 2024 (0 in 5+ unit buildings).
- Winnebago County population projected at -20% by 2050 — secular population decline; favor cash flow + early exit over multi-decade hold.
- 2 sale attempts since 3y ago with the ask held roughly flat each time — persistent listings suggest the price (not the market) is what's stuck; bring a comps-based counter.
- Current owner paid $82k; 21% above their basis — modest negotiation headroom, anchor on the comps not their cost.
- Climate carrying-cost: in FEMA flood zone AE (mandatory federal flood insurance) — expect insurance premiums to compound above CPI over the hold.
- Cap rate 11.3% vs local median 6.1% in Rockford — top-decile yield for the area; either an underpriced asset or a hidden risk that comps aren't pricing in. Stress-test before assuming the spread holds.
- At $1,344/mo this rent would consume 48% of the median local household income ($34k/yr) (locally 1406% of renters already pay >50% of income on rent) — very limited rent-growth headroom before tenants either downsize or default.
Questions for listing agent
- What do current leases actually rent for vs. the listed asking? Can we see a recent rent roll and the last 12 months of T-12 income?
- Built in 1920 — when were the roof, HVAC, electrical panel, plumbing, and water heater last replaced?
- What's the actual annual flood-insurance premium (NFIP or private), and is the property in a SFHA with mandatory coverage?
- Is there a deadline driving the sale (1031 exchange, divorce, estate, relocation)? That informs how much negotiation room exists.
- Schools are F-rated, which usually means shorter tenancies and higher turnover. Who's the typical renter profile here, and what's been the actual vacancy rate?
- Crime grade is F in this area — have there been break-ins, vandalism, or insurance claims at this property in the last 3 years? What carrier currently insures it and at what premium?
- What's the average days-on-market for RENTAL listings here right now (not sales)? A rising rental-DOM trend means longer vacancies and softer asking-rent achievability than the comps imply.
- What's the recent tenant-quality profile in this submarket — average credit score on applications, eviction rate, late-payment / NSF rate, and stable-employment percentage? A property-management company in the area should have these aggregated.
CashFlowRE · CFR-K11A933XBMXQBW
· Data 4 weeks ago
cashflowre.app · 2026-05-29