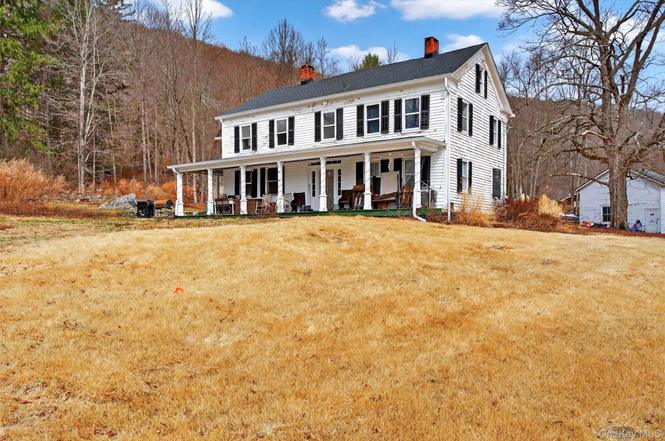
611 Peekskill Hollow Rd
Jefferson Valley-Yorktown, NY 10579
$485,000C-
4 bd · 2.5 ba ·
2,739 sqft ·
Built 1835
· SingleFamily
· Pending
· 23 DOM
Cashflow @ list (25.0% down · 7.5%)
Estimated rent
$4,519/mo
Mortgage (P&I)
−$2,543
Tax + insurance
−$1,781
HOA
−$0
Vac / Maint / Mgmt
−$949
Net cashflow
$-754/mo
Annual
$-9,045/yr
Cap rate
4.43%
Cash-on-cash
-6.66%
DSCR
0.70
1% rule
0.93%
Cash to close
$135,800
Investor read
- This is a 4-bed/2.5-bath single-family listed at $485k.
- At list price, monthly cash flow is $-754 ($-9k/yr) — negative.
- To cash-flow at today's rent, offer at most $379k (21.9% below list).
- To meet the 1% rule (rent ≥ 1% of price), the offer needs to be $452k (6.8% below list).
- It's been on market 23 days — a 2% lower offer ($478k) is reasonable based on typical stale-listing flexibility.
- Recommended offer: $379k (21.9% below list) — sets the bar for cash-flow.
- In year one you build about $52k of equity ($3k loan paydown + $48k appreciation (10.0% local appreciation)).
- Location reads: area grade C — affects rentability + tenant quality, not the cash-flow math above.
- Putnam Valley Central School District (suburban): math 73% / reading 71% proficiency, ranked #91 of 590 in NY (top 15%) — strong family-tenant draw, lease renewals of 3-5y typical; only 12% free/reduced lunch — higher-income household profile.
- Zoned schools: Putnam Valley Elementary School (math 87% / reading 82%, grade A+, #93 of 2,108 statewide, top 6%, 554 students, 19% FRL); Putnam Valley Middle School (math 57% / reading 65%, grade B+, #150 of 729 statewide, top 21%, 473 students, 17% FRL); Putnam Valley High School (math 92% / reading 24%, grade C, #879 of 1,100 statewide, top 80%, 503 students, 23% FRL).
- Watch-outs: property tax is 3.9% of price; built in 1835 — expect roof / HVAC / electrical / plumbing capex.
- Market conditions: 54 active listings in the ZIP; 142 units permitted in Putnam County in 2024 (75 in 5+ unit buildings).
- Putnam County population projected to shrink 3% by 2050 — rents likely to lag national; underwrite the cash flow, not the appreciation.
- 6 sale attempts since 25y ago with the ask held roughly flat each time — persistent listings suggest the price (not the market) is what's stuck; bring a comps-based counter.
- By year 2, paydown + projected appreciation supports a ~$83k cash-out refi (75% LTV) — recoverable capital for the next deal without selling this one.
- Climate carrying-cost: moderate wildfire risk — expect insurance premiums to compound above CPI over the hold.
- Cap rate 4.4% vs local median 2.8% in Jefferson Valley-Yorktown — top-decile yield for the area; either an underpriced asset or a hidden risk that comps aren't pricing in. Stress-test before assuming the spread holds.
Questions for listing agent
- What do current leases actually rent for vs. the listed asking? Can we see a recent rent roll and the last 12 months of T-12 income?
- Built in 1835 — when were the roof, HVAC, electrical panel, plumbing, and water heater last replaced?
- Property tax is high relative to price — has the assessment been appealed recently, and will the sale trigger a re-assessment?
- Is there a deadline driving the sale (1031 exchange, divorce, estate, relocation)? That informs how much negotiation room exists.
- What's the average days-on-market for RENTAL listings here right now (not sales)? A rising rental-DOM trend means longer vacancies and softer asking-rent achievability than the comps imply.
- What's the recent tenant-quality profile in this submarket — average credit score on applications, eviction rate, late-payment / NSF rate, and stable-employment percentage? A property-management company in the area should have these aggregated.
- How much new for-sale + rental construction is in the pipeline within 1–3 miles? Heavy new supply typically softens prices + rents 12–24 months out; constrained supply supports both.
CashFlowRE · CFR-K29AVJ24K3FTC5
· Data 4 weeks ago
cashflowre.app · 2026-05-29