1616 Liholiho St #1003
Urban Honolulu, HI 96822
$335,000D
2 bd · 1.0 ba ·
654 sqft ·
Built 1974
· Condo
· Active
· 4 DOM
Cashflow @ list (25.0% down · 7.5%)
Estimated rent
$3,176/mo
Mortgage (P&I)
−$1,757
Tax + insurance
−$316
HOA
−$754
Vac / Maint / Mgmt
−$667
Net cashflow
$-317/mo
Annual
$-3,807/yr
Cap rate
5.39%
Cash-on-cash
-3.21%
DSCR
0.86
1% rule
0.95%
Cash to close
$93,800
Investor read
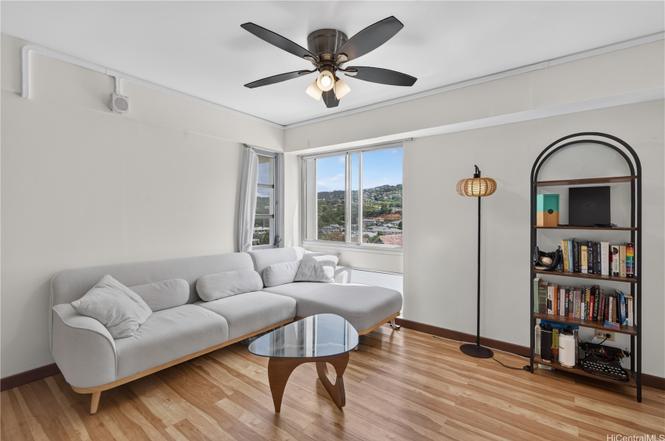
- This is a 2-bed/1.0-bath condo listed at $335k.
- At list price, monthly cash flow is $-317 ($-4k/yr) — negative.
- To cash-flow at today's rent, offer at most $279k (16.7% below list).
- To meet the 1% rule (rent ≥ 1% of price), the offer needs to be $318k (5.2% below list).
- Only 4 days on market — expect competitive offers; lowballing is unlikely to land.
- Recommended offer: $279k (16.7% below list) — sets the bar for cash-flow.
- In year one you build about $11k of equity ($2k loan paydown + $9k appreciation (2.7% local appreciation)).
- Location reads: area grade D — affects rentability + tenant quality, not the cash-flow math above.
- Hawaii Department Of Education (suburban): math 32% / reading 50% proficiency, ranked #1 of 1 in HI (top 100%) — families likely to look elsewhere, expect single-tenant / working-renter base with shorter leases.
- Watch-outs: flood insurance adds $66/mo; HOA is 24% of rent.
- Market conditions: Rents rising fast (+5.3%/yr); 180 active listings in the ZIP; 40 comparable units currently listed for rent nearby; rentals at typical pace (median 19d on market — plan ~3-4 weeks tenant-placement turnaround); solid renter incomes; 1,638 units permitted in Honolulu County in 2024 (793 in 5+ unit buildings).
- Honolulu County population projected at +17% by 2050 — long-run rental-demand tailwind backs the buy-and-hold thesis.
- 2 sale attempts since 2y ago with the ask held roughly flat each time — persistent listings suggest the price (not the market) is what's stuck; bring a comps-based counter.
- Current owner paid $52k; list at $335k implies a 544% gain — meaningful room to come down on a strong offer.
- By year 4, paydown + projected appreciation supports a ~$39k cash-out refi (75% LTV) — recoverable capital for the next deal without selling this one.
- Climate carrying-cost: severe flood risk — expect insurance premiums to compound above CPI over the hold.
- Cap rate 5.4% vs local median 1.5% in Urban Honolulu — top-decile yield for the area; either an underpriced asset or a hidden risk that comps aren't pricing in. Stress-test before assuming the spread holds.
- This rent runs 40% of the median local income ($96k/yr) — at the standard rent-burdened threshold; future hikes will face affordability resistance.
Questions for listing agent
- What do current leases actually rent for vs. the listed asking? Can we see a recent rent roll and the last 12 months of T-12 income?
- Built in 1974 — when were the roof, HVAC, electrical panel, plumbing, and water heater last replaced?
- What's the actual annual flood-insurance premium (NFIP or private), and is the property in a SFHA with mandatory coverage?
- What does the HOA fee cover, when was the last increase, and are there any pending special assessments or reserve-fund shortfalls?
- Any open or pending special assessments — roof, HVAC, plumbing, elevator, façade? What's the per-unit balance and payoff schedule, and is the seller paying it off at close or rolling it to the buyer?
- Is there a deadline driving the sale (1031 exchange, divorce, estate, relocation)? That informs how much negotiation room exists.
- The area grade is low — what's the realistic commute time and amenity access for the typical tenant pool here? Any planned neighborhood developments (good or bad) we should know about?
- What's the average days-on-market for RENTAL listings here right now (not sales)? A rising rental-DOM trend means longer vacancies and softer asking-rent achievability than the comps imply.
CashFlowRE · CFR-K4J33RCB8YNZ5C
· Data 10 h ago
cashflowre.app · 2026-05-29