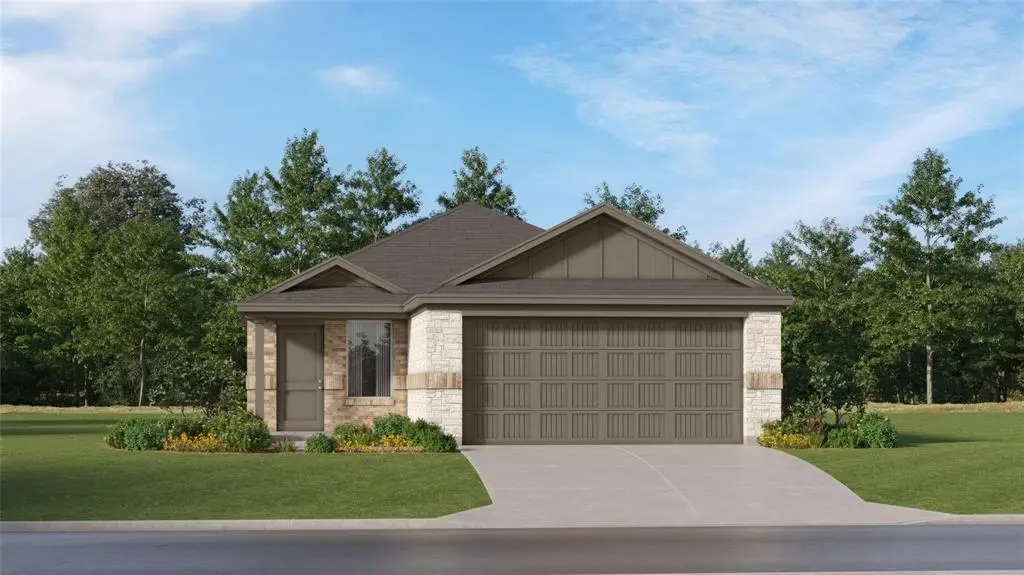
1301 Little Flock Dr
Fort Worth, TX 76036
$270,999C+
4 bd · 2.0 ba ·
1,656 sqft ·
Built 2026
· SingleFamily
· Pending
· 18 DOM
Cashflow @ list (25.0% down · 7.5%)
Estimated rent
$2,896/mo
Mortgage (P&I)
−$1,421
Tax + insurance
−$452
HOA
−$42
Vac / Maint / Mgmt
−$608
Net cashflow
$373/mo
Annual
$4,479/yr
Cap rate
7.95%
Cash-on-cash
5.90%
DSCR
1.26
1% rule
1.07%
Cash to close
$75,880
Investor read
- This is a 4-bed/2.0-bath single-family listed at $271k. Condition is rated excellent.
- At list price, monthly cash flow is $373 ($4k/yr) — positive.
- The deal already cash-flows at list — no discount required.
- Meets the 1% rule at list price ($3k rent vs $271k).
- It's been on market 18 days — a 2% lower offer ($267k) is reasonable based on typical stale-listing flexibility.
- Recommended offer: $267k (1.5% below list) — sets the bar for market timing.
- Local home prices are declining (-3.0%/yr); year-one equity from $2k of loan paydown is wiped out by about $8k of value loss. Plan a longer hold.
- Location reads 80/100 on livability (#49 in TX, #1,954 nationally) — a professional / high-income tenant draw. Strengths: amenities A+, cost of living A+, housing A+; Watch: crime F.
- Crowley ISD (urban): math 23% / reading 32% proficiency, ranked #643 of 826 in TX (top 78%) — low school quality limits family demand, transient renter base, plan for 1-2y turnover.
- Zoned schools: David L Walker Elt (math 12% / reading 22%, grade F, #3,836 of 4,322 statewide, top 91%, 417 students, 87% FRL) — zoned schools average 87% FRL vs 52% district-wide (35 pts higher); higher-poverty schools than district average — tighter screening recommended.
- Market conditions: Rents rising (+2.3%/yr); 1018 active listings in the ZIP; 2 comparable units currently listed for rent nearby; solid renter incomes; 18,938 units permitted in Tarrant County in 2024 (8,336 in 5+ unit buildings).
- Tarrant County population projected at +41% by 2050 — long-run rental-demand tailwind backs the buy-and-hold thesis.
- Climate carrying-cost: major wind risk, 27% chance of damaging wind over 30y; moderate wildfire risk; extreme-heat days projected 7→23/yr by 2055 (HVAC capex compounding) — expect insurance premiums to compound above CPI over the hold.
- Cap rate 7.9% vs local median 3.9% in Fort Worth — top-decile yield for the area; either an underpriced asset or a hidden risk that comps aren't pricing in. Stress-test before assuming the spread holds.
- This rent runs 35% of the median local income ($98k/yr) — at the standard rent-burdened threshold; future hikes will face affordability resistance.
Questions for listing agent
- What does the HOA fee cover, when was the last increase, and are there any pending special assessments or reserve-fund shortfalls?
- Is there a deadline driving the sale (1031 exchange, divorce, estate, relocation)? That informs how much negotiation room exists.
- Schools are D-rated, which usually means shorter tenancies and higher turnover. Who's the typical renter profile here, and what's been the actual vacancy rate?
- Crime grade is F in this area — have there been break-ins, vandalism, or insurance claims at this property in the last 3 years? What carrier currently insures it and at what premium?
- What's the average days-on-market for RENTAL listings here right now (not sales)? A rising rental-DOM trend means longer vacancies and softer asking-rent achievability than the comps imply.
- What's the recent tenant-quality profile in this submarket — average credit score on applications, eviction rate, late-payment / NSF rate, and stable-employment percentage? A property-management company in the area should have these aggregated.
- How much new for-sale + rental construction is in the pipeline within 1–3 miles? Heavy new supply typically softens prices + rents 12–24 months out; constrained supply supports both.
CashFlowRE · CFR-K59GFS31JEXJCJ
· Data 3 weeks ago
cashflowre.app · 2026-05-29