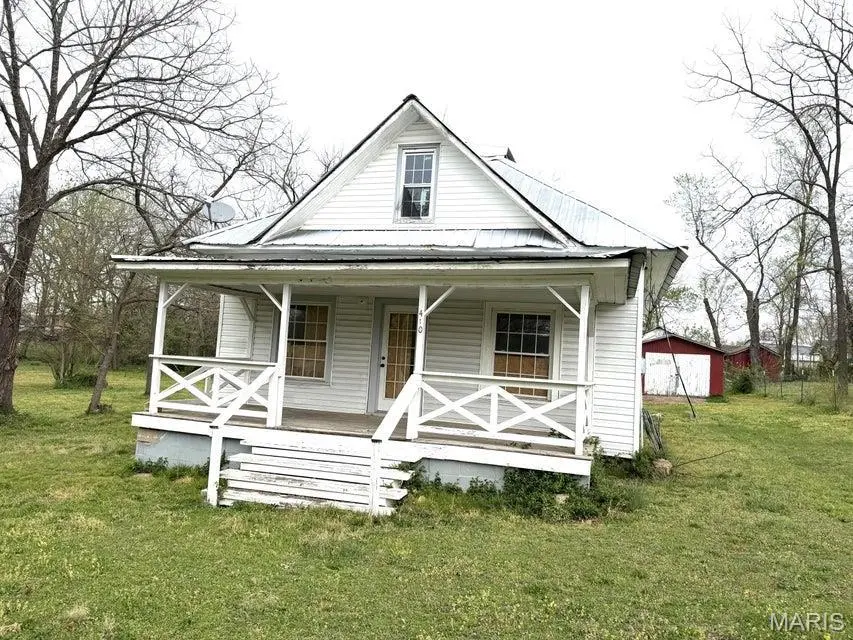
410 E 3rd St
Mountain View, MO 65548
$69,900B
1 bd · 1.0 ba ·
960 sqft ·
Built 1925
· Other
· Pending
· 21 DOM
Cashflow @ list (25.0% down · 7.5%)
Estimated rent
$854/mo
Mortgage (P&I)
−$367
Tax + insurance
−$45
HOA
−$0
Vac / Maint / Mgmt
−$179
Net cashflow
$264/mo
Annual
$3,163/yr
Cap rate
10.82%
Cash-on-cash
16.16%
DSCR
1.72
1% rule
1.22%
Cash to close
$19,572
Investor read
- This is a 1-bed/1.0-bath other listed at $70k.
- At list price, monthly cash flow is $264 ($3k/yr) — positive.
- The deal already cash-flows at list — no discount required.
- Meets the 1% rule at list price ($854 rent vs $70k).
- It's been on market 21 days — a 2% lower offer ($69k) is reasonable based on typical stale-listing flexibility.
- Recommended offer: $69k (1.5% below list) — sets the bar for market timing.
- Local home prices are declining (-3.0%/yr); year-one equity from $483 of loan paydown is wiped out by about $2k of value loss. Plan a longer hold.
- Location reads 67/100 on livability (#212 in MO) — a middle-class / working-renter tenant base. Strengths: cost of living A+, housing A+, crime B+; Watch: employment C-, amenities F, commute F.
- Mountain View-Birch Tree R-III (rural): math 41% / reading 41% proficiency, ranked #158 of 324 in MO (top 49%) — families likely to look elsewhere, expect single-tenant / working-renter base with shorter leases.
- Zoned schools: Mountain View Elem. (math 40% / reading 41%, grade F, #525 of 1,115 statewide, top 47%, 404 students, 55% FRL); Liberty Sr. High (math 67% / reading 57%, grade B-, #28 of 521 statewide, top 6%, 341 students, 59% FRL) — zoned schools at 57% FRL track the district average.
- Watch-outs: built in 1925 — expect roof / HVAC / electrical / plumbing capex.
- Market conditions: 60 active listings in the ZIP; 53 units permitted in Howell County in 2024 (0 in 5+ unit buildings).
- Howell County population projected at -18% by 2050 — secular population decline; favor cash flow + early exit over multi-decade hold.
- 2 sale attempts with the ask held roughly flat each time — persistent listings suggest the price (not the market) is what's stuck; bring a comps-based counter.
- At projected returns (-3.0% appreciation + 3.0% rent growth), your $20k cash investment doubles in ~8 years — after that, you're playing with house money.
- Climate carrying-cost: moderate wildfire risk; extreme-heat days projected 7→19/yr by 2055 (HVAC capex compounding) — expect insurance premiums to compound above CPI over the hold.
- Cap rate 10.8% vs local median 3.9% in Mountain View — top-decile yield for the area; either an underpriced asset or a hidden risk that comps aren't pricing in. Stress-test before assuming the spread holds.
Questions for listing agent
- Built in 1925 — when were the roof, HVAC, electrical panel, plumbing, and water heater last replaced?
- Is there a deadline driving the sale (1031 exchange, divorce, estate, relocation)? That informs how much negotiation room exists.
- Schools are F-rated, which usually means shorter tenancies and higher turnover. Who's the typical renter profile here, and what's been the actual vacancy rate?
- What's the average days-on-market for RENTAL listings here right now (not sales)? A rising rental-DOM trend means longer vacancies and softer asking-rent achievability than the comps imply.
- What's the recent tenant-quality profile in this submarket — average credit score on applications, eviction rate, late-payment / NSF rate, and stable-employment percentage? A property-management company in the area should have these aggregated.
- How much new for-sale + rental construction is in the pipeline within 1–3 miles? Heavy new supply typically softens prices + rents 12–24 months out; constrained supply supports both.
CashFlowRE · CFR-K9379S5YAVWSWK
· Data 1 week ago
cashflowre.app · 2026-05-29