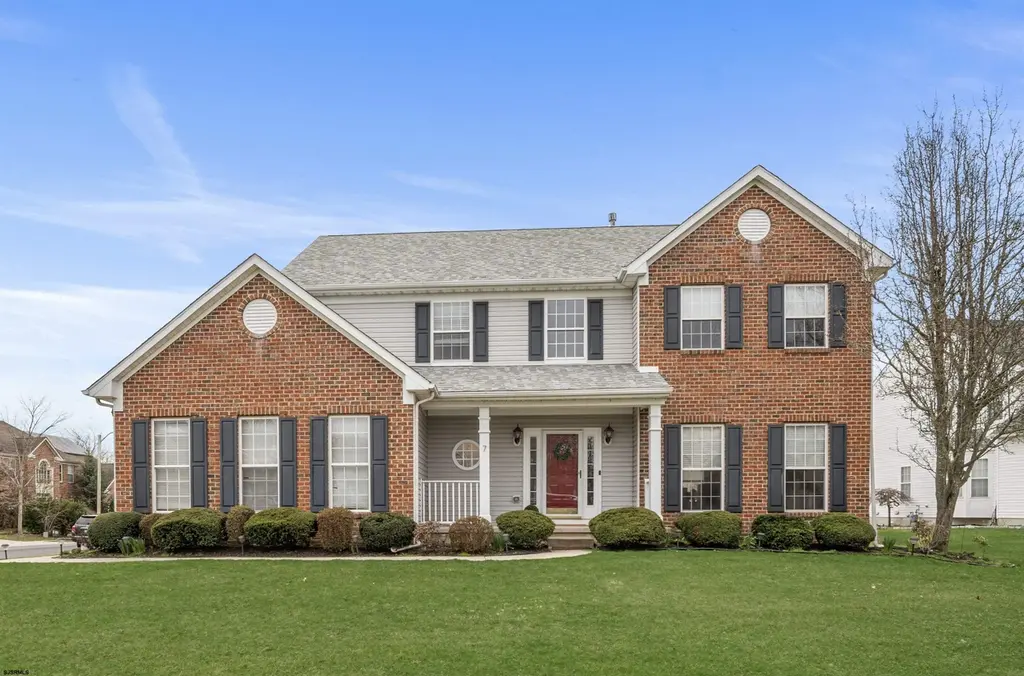
7 Crossing Dr
Linwood, NJ 08221
$759,000D+
4 bd · 3.5 ba ·
3,937 sqft ·
Built 1999
· SingleFamily
· Under Contract
· 86 DOM
Cashflow @ list (25.0% down · 7.5%)
Estimated rent
$7,000/mo
Mortgage (P&I)
−$3,980
Tax + insurance
−$1,624
HOA
−$41
Vac / Maint / Mgmt
−$1,470
Net cashflow
$-115/mo
Annual
$-1,379/yr
Cap rate
6.11%
Cash-on-cash
-0.65%
DSCR
0.97
1% rule
0.92%
Cash to close
$212,520
Investor read
- This is a 4-bed/3.5-bath single-family listed at $759k.
- At list price, monthly cash flow is $-115 ($-1k/yr) — negative.
- To cash-flow at today's rent, offer at most $739k (2.7% below list).
- To meet the 1% rule (rent ≥ 1% of price), the offer needs to be $700k (7.8% below list).
- It's been on market 86 days — a 6% lower offer ($713k) is reasonable based on typical stale-listing flexibility.
- Recommended offer: $700k (7.8% below list) — sets the bar for 1% rule.
- Local home prices are declining (-3.0%/yr); year-one equity from $5k of loan paydown is wiped out by about $23k of value loss. Plan a longer hold.
- Location reads 76/100 on livability (#139 in NJ, #3,693 nationally) — a middle-class / working-renter tenant base. Strengths: crime A+, employment A+, housing A+; Watch: amenities F, commute F, cost of living F.
- Linwood City School District (suburban): math 41% / reading 68% proficiency, ranked #90 of 472 in NJ (top 19%) — acceptable for families but not a draw, mixed tenant base, ~2y average lease; only 5% free/reduced lunch — higher-income household profile.
- Zoned schools: Seaview Elementary School (math 42% / reading 57%, grade D, #256 of 1,303 statewide, top 22%, 445 students, 9% FRL); Belhaven Middle School (math 40% / reading 72%, grade B-, #58 of 431 statewide, top 14%, 358 students, 11% FRL); Mainland Regional High School (math 34% / reading 55%, grade F, #149 of 399 statewide, top 40%, 1,181 students, 19% FRL).
- Market conditions: 90 active listings in the ZIP; 1 comparable units currently listed for rent nearby; 672 units permitted in Atlantic County in 2024 (258 in 5+ unit buildings).
- Atlantic County population projected at -12% by 2050 — secular population decline; favor cash flow + early exit over multi-decade hold.
- 4 sale attempts since 14y ago with the ask held roughly flat each time — persistent listings suggest the price (not the market) is what's stuck; bring a comps-based counter.
- Current owner paid $642k; 18% above their basis — modest negotiation headroom, anchor on the comps not their cost.
- Cap rate 6.1% vs local median 1.6% in Linwood — top-decile yield for the area; either an underpriced asset or a hidden risk that comps aren't pricing in. Stress-test before assuming the spread holds.
Questions for listing agent
- What do current leases actually rent for vs. the listed asking? Can we see a recent rent roll and the last 12 months of T-12 income?
- It's been on market 86 days. Have you received any prior offers? Is the seller open to a 8% concession, seller financing, or rate buy-down credit?
- What does the HOA fee cover, when was the last increase, and are there any pending special assessments or reserve-fund shortfalls?
- Why hasn't it sold? Are there any deal-killer items the seller is aware of (foundation, flood, title, zoning, code violations)?
- Is there a deadline driving the sale (1031 exchange, divorce, estate, relocation)? That informs how much negotiation room exists.
- Schools are A-rated — typically a magnet for longer-tenancy family renters. What's the average tenant stay here, and is there a school-zone premium baked into asking?
- The area grade is low — what's the realistic commute time and amenity access for the typical tenant pool here? Any planned neighborhood developments (good or bad) we should know about?
- What's the average days-on-market for RENTAL listings here right now (not sales)? A rising rental-DOM trend means longer vacancies and softer asking-rent achievability than the comps imply.
CashFlowRE · CFR-K9AC207JKE40DN
· Data 6 h ago
cashflowre.app · 2026-05-29