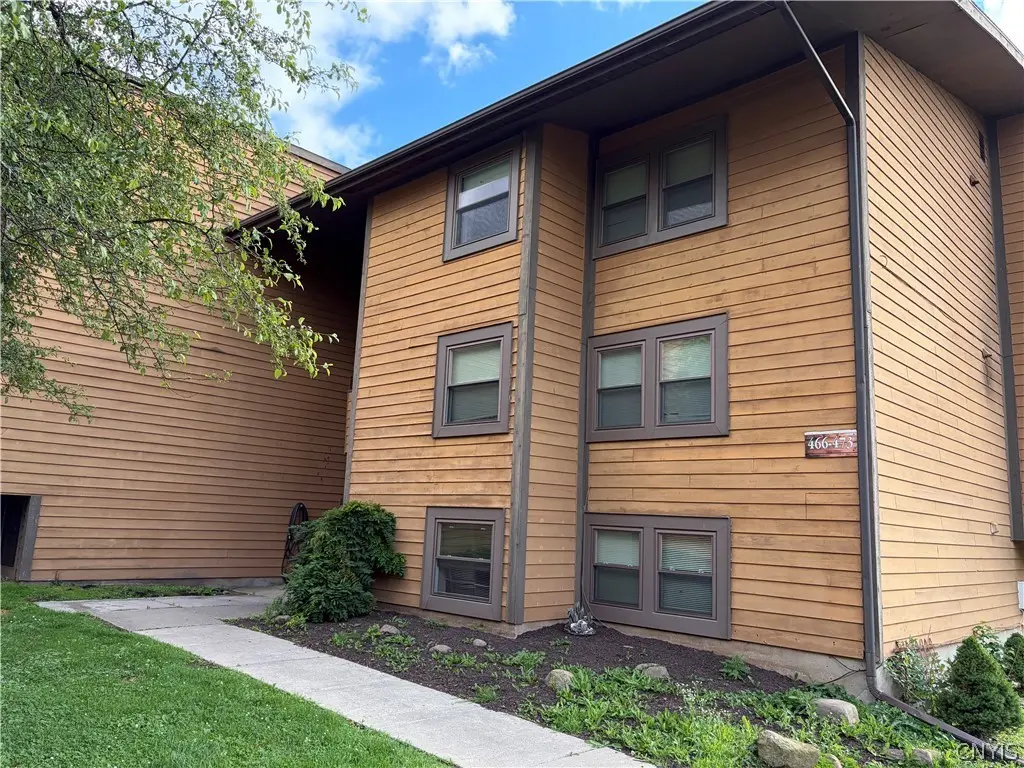
466 Idlewood Blvd
Village Green, NY 13027
$164,900B
3 bd · 1.5 ba ·
1,043 sqft ·
Built 1975
· MultiFamily
· Active
· 1 DOM
Cashflow @ list (25.0% down · 7.5%)
Estimated rent
$3,658/mo
Mortgage (P&I)
−$865
Tax + insurance
−$224
HOA
−$226
Vac / Maint / Mgmt
−$768
Net cashflow
$1,575/mo
Annual
$18,902/yr
Cap rate
17.76%
Cash-on-cash
40.94%
DSCR
2.82
1% rule
2.22%
Cash to close
$46,172
Investor read
- This is a 3-bed/1.5-bath multifamily listed at $165k.
- At list price, monthly cash flow is $2k ($19k/yr) — positive.
- The deal already cash-flows at list — no discount required.
- Meets the 1% rule at list price ($4k rent vs $165k).
- Only 1 days on market — expect competitive offers; lowballing is unlikely to land.
- Local home prices are declining (-3.0%/yr); year-one equity from $1k of loan paydown is wiped out by about $5k of value loss. Plan a longer hold.
- Location reads 64/100 on livability (#720 in NY) — a middle-class / working-renter tenant base. Strengths: housing A+, cost of living A, crime B; Watch: employment C-, amenities F, commute F.
- Baldwinsville Central School District (suburban): math 47% / reading 53% proficiency, ranked #355 of 590 in NY (top 60%) — acceptable for families but not a draw, mixed tenant base, ~2y average lease; only 18% free/reduced lunch — higher-income household profile.
- Market conditions: 222 active listings in the ZIP; 4 comparable units currently listed for rent nearby; rentals at typical pace (median 14d on market — plan ~3-4 weeks tenant-placement turnaround); solid renter incomes; 616 units permitted in Onondaga County in 2024 (256 in 5+ unit buildings).
- Onondaga County population projected to shrink 9% by 2050 — rents likely to lag national; underwrite the cash flow, not the appreciation.
- 4 sale attempts since 4y ago with the ask held roughly flat each time — persistent listings suggest the price (not the market) is what's stuck; bring a comps-based counter.
- Current owner paid $104k; list at $165k implies a 59% gain — meaningful room to come down on a strong offer.
- At projected returns (-3.0% appreciation + 3.0% rent growth), your $46k cash investment doubles in ~3 years — after that, you're playing with house money.
- Cap rate 17.8% vs local median 5.3% in Village Green — top-decile yield for the area; either an underpriced asset or a hidden risk that comps aren't pricing in. Stress-test before assuming the spread holds.
- At $3,658/mo this rent would consume 48% of the median local household income ($92k/yr) (locally 1057% of renters already pay >50% of income on rent) — very limited rent-growth headroom before tenants either downsize or default.
Questions for listing agent
- Built in 1975 — when were the roof, HVAC, electrical panel, plumbing, and water heater last replaced?
- What does the HOA fee cover, when was the last increase, and are there any pending special assessments or reserve-fund shortfalls?
- Is there a deadline driving the sale (1031 exchange, divorce, estate, relocation)? That informs how much negotiation room exists.
- What's the average days-on-market for RENTAL listings here right now (not sales)? A rising rental-DOM trend means longer vacancies and softer asking-rent achievability than the comps imply.
- What's the recent tenant-quality profile in this submarket — average credit score on applications, eviction rate, late-payment / NSF rate, and stable-employment percentage? A property-management company in the area should have these aggregated.
- How much new apartment / multifamily construction is in the pipeline within 1–3 miles? Heavy new supply (>2% of stock underway) typically softens rents 12–24 months out; light construction supports rent growth.
CashFlowRE · CFR-K9EBTC3YDYPZCH
· Data 2 days ago
cashflowre.app · 2026-05-29