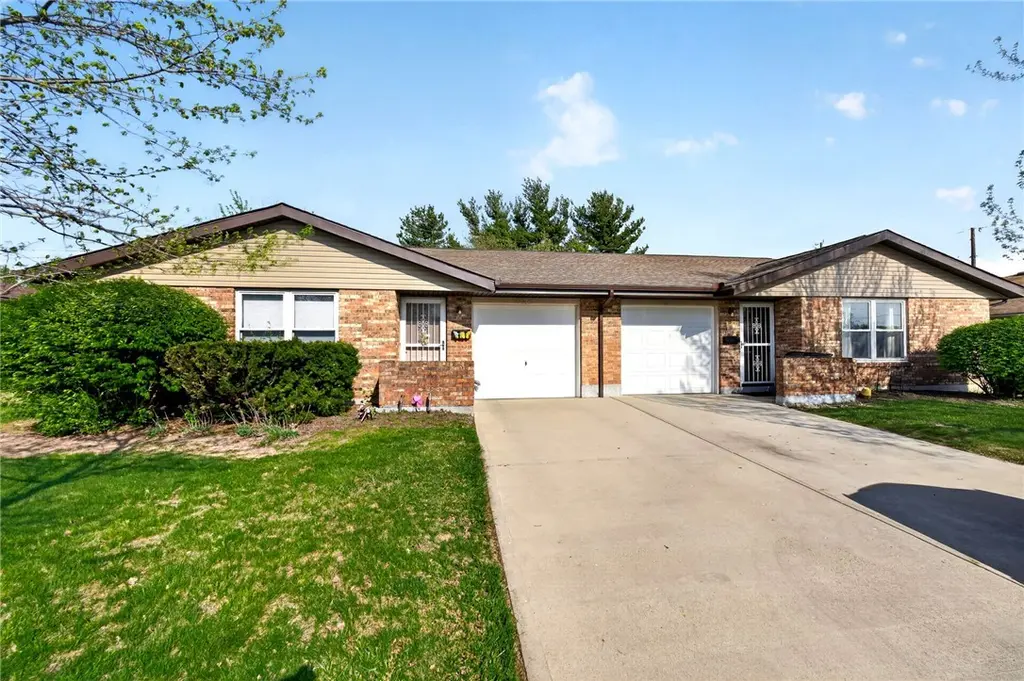
5620 Elgin Roof Rd
Trotwood, OH 45426
$215,000C+
4 bd · 3.0 ba ·
2,231 sqft ·
Built 1970
· MultiFamily
· Pending
· 2 DOM
Cashflow @ list (25.0% down · 7.5%)
Estimated rent
$2,614/mo
Mortgage (P&I)
−$1,127
Tax + insurance
−$357
HOA
−$0
Vac / Maint / Mgmt
−$549
Net cashflow
$581/mo
Annual
$6,967/yr
Cap rate
9.53%
Cash-on-cash
11.57%
DSCR
1.51
1% rule
1.22%
Cash to close
$60,200
Investor read
- This is a 2 × 2.0-bed/1.5-bath units multifamily listed at $215k.
- At list price, monthly cash flow is $581 ($7k/yr) — positive. Per door: $290/mo.
- The deal already cash-flows at list — no discount required.
- Meets the 1% rule at list price ($3k rent vs $215k).
- Only 2 days on market — expect competitive offers; lowballing is unlikely to land.
- Local home prices are declining (-3.0%/yr); year-one equity from $1k of loan paydown is wiped out by about $6k of value loss. Plan a longer hold.
- Location reads 59/100 on livability (#1,014 in OH) — a working-class tenant base; expect higher turnover. Strengths: cost of living A+, housing A; Watch: employment D, schools F, crime F.
- Trotwood-Madison City (suburban): math 9% / reading 21% proficiency, ranked #645 of 656 in OH (top 98%) — low school quality limits family demand, transient renter base, plan for 1-2y turnover; 78% free/reduced lunch — lower-income household profile, screen leases tightly.
- Market conditions: 48 active listings in the ZIP; 3 comparable units currently listed for rent nearby; rentals lingering (median 44d on market — plan ~5-8 weeks vacancy on turnover, expect pricing pressure); 67% of comp listings sitting > 30 days — soft ceiling on asking rent; 907 units permitted in Montgomery County in 2024 (416 in 5+ unit buildings).
- Montgomery County population projected at -10% by 2050 — secular population decline; favor cash flow + early exit over multi-decade hold.
- Current owner paid $92k; list at $215k implies a 134% gain — meaningful room to come down on a strong offer.
- At projected returns (-3.0% appreciation + 3.0% rent growth), your $60k cash investment doubles in ~10 years — after that, you're playing with house money.
- Cap rate 9.5% vs local median 6.5% in Trotwood — top-decile yield for the area; either an underpriced asset or a hidden risk that comps aren't pricing in. Stress-test before assuming the spread holds.
- At $2,614/mo this rent would consume 60% of the median local household income ($52k/yr) (locally 852% of renters already pay >50% of income on rent) — very limited rent-growth headroom before tenants either downsize or default.
Questions for listing agent
- Can we see the unit-by-unit rent roll, current vacancy, and any below-market leases? What's the average tenancy length?
- What capital expenditures (roof, boiler, parking lot, exteriors) have been made in the last 5 years, and what's planned in the next 2?
- Built in 1970 — when were the roof, HVAC, electrical panel, plumbing, and water heater last replaced?
- Is there a deadline driving the sale (1031 exchange, divorce, estate, relocation)? That informs how much negotiation room exists.
- Schools are F-rated, which usually means shorter tenancies and higher turnover. Who's the typical renter profile here, and what's been the actual vacancy rate?
- Crime grade is F in this area — have there been break-ins, vandalism, or insurance claims at this property in the last 3 years? What carrier currently insures it and at what premium?
- What's the average days-on-market for RENTAL listings here right now (not sales)? A rising rental-DOM trend means longer vacancies and softer asking-rent achievability than the comps imply.
- What's the recent tenant-quality profile in this submarket — average credit score on applications, eviction rate, late-payment / NSF rate, and stable-employment percentage? A property-management company in the area should have these aggregated.
CashFlowRE · CFR-KA7PNXDC79J3JC
· Data 3 weeks ago
cashflowre.app · 2026-05-29