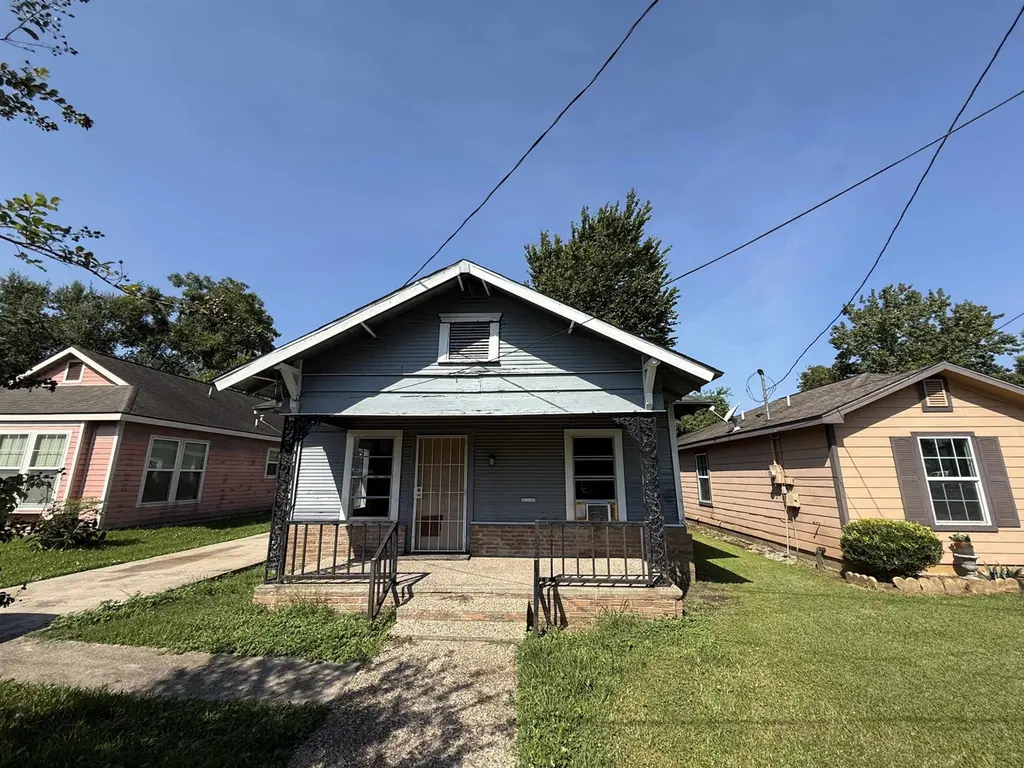
1930 Cleo St
Beaumont, TX 77701
$39,000B+
3 bd · 1.0 ba ·
1,000 sqft ·
Built 1962
· SingleFamily
· Pending
· 61 DOM
Cashflow @ list (25.0% down · 7.5%)
Estimated rent
$1,234/mo
Mortgage (P&I)
−$205
Tax + insurance
−$110
HOA
−$0
Vac / Maint / Mgmt
−$259
Net cashflow
$660/mo
Annual
$7,916/yr
Cap rate
26.59%
Cash-on-cash
72.49%
DSCR
4.23
1% rule
3.16%
Cash to close
$10,920
Investor read
- This is a 3-bed/1.0-bath single-family listed at $39k.
- At list price, monthly cash flow is $660 ($8k/yr) — positive.
- The deal already cash-flows at list — no discount required.
- Meets the 1% rule at list price ($1k rent vs $39k).
- It's been on market 61 days — a 6% lower offer ($37k) is reasonable based on typical stale-listing flexibility.
- Recommended offer: $37k (6.0% below list) — sets the bar for market timing.
- In year one you build about $3k of equity ($270 loan paydown + $2k appreciation (6.2% local appreciation)).
- Location reads 64/100 on livability (#739 in TX) — a middle-class / working-renter tenant base. Strengths: cost of living A+, housing A+, health & safety A+; Watch: employment D, schools D-, crime F.
- Beaumont ISD (urban): math 14% / reading 22% proficiency, ranked #789 of 826 in TX (top 96%) — low school quality limits family demand, transient renter base, plan for 1-2y turnover; 69% free/reduced lunch — lower-income household profile, screen leases tightly.
- Watch-outs: property tax is 2.9% of price.
- Market conditions: 73 active listings in the ZIP; 19 comparable units currently listed for rent nearby; rentals at typical pace (median 14d on market — plan ~3-4 weeks tenant-placement turnaround); 343 units permitted in Jefferson County in 2024 (0 in 5+ unit buildings).
- 2 sale attempts with the ask held roughly flat each time — persistent listings suggest the price (not the market) is what's stuck; bring a comps-based counter.
- At projected returns (6.2% appreciation + 3.0% rent growth), your $11k cash investment doubles in ~2 years — after that, you're playing with house money.
- Climate carrying-cost: severe wind risk, 99% chance of damaging wind over 30y; extreme-heat days projected 7→24/yr by 2055 (HVAC capex compounding) — expect insurance premiums to compound above CPI over the hold.
- Cap rate 26.6% vs local median 5.3% in Beaumont — top-decile yield for the area; either an underpriced asset or a hidden risk that comps aren't pricing in. Stress-test before assuming the spread holds.
- This rent runs 30% of the median local income ($49k/yr) — at the standard rent-burdened threshold; future hikes will face affordability resistance.
Questions for listing agent
- It's been on market 61 days. Have you received any prior offers? Is the seller open to a 6% concession, seller financing, or rate buy-down credit?
- Built in 1962 — when were the roof, HVAC, electrical panel, plumbing, and water heater last replaced?
- Property tax is high relative to price — has the assessment been appealed recently, and will the sale trigger a re-assessment?
- Why hasn't it sold? Are there any deal-killer items the seller is aware of (foundation, flood, title, zoning, code violations)?
- Is there a deadline driving the sale (1031 exchange, divorce, estate, relocation)? That informs how much negotiation room exists.
- Schools are D-rated, which usually means shorter tenancies and higher turnover. Who's the typical renter profile here, and what's been the actual vacancy rate?
- Crime grade is F in this area — have there been break-ins, vandalism, or insurance claims at this property in the last 3 years? What carrier currently insures it and at what premium?
- What's the average days-on-market for RENTAL listings here right now (not sales)? A rising rental-DOM trend means longer vacancies and softer asking-rent achievability than the comps imply.
CashFlowRE · CFR-KCMXS6AB198ECH
· Data 2 days ago
cashflowre.app · 2026-05-29