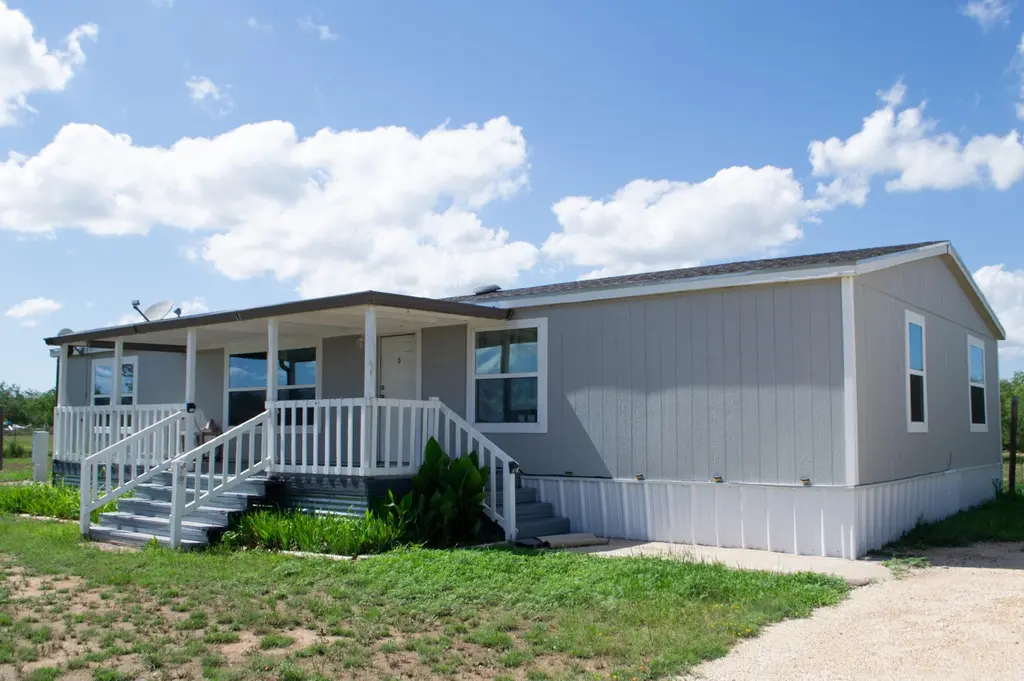
10570 W Indian Creek Rd
Grape Creek, TX 76901
$165,000B
4 bd · 2.0 ba ·
1,568 sqft ·
Built 2011
· Manufactured
· Active
· 18 DOM
Cashflow @ list (25.0% down · 7.5%)
Estimated rent
$1,930/mo
Mortgage (P&I)
−$865
Tax + insurance
−$142
HOA
−$0
Vac / Maint / Mgmt
−$405
Net cashflow
$517/mo
Annual
$6,200/yr
Cap rate
10.05%
Cash-on-cash
13.42%
DSCR
1.60
1% rule
1.17%
Cash to close
$46,200
Investor read
- This is a 4-bed/2.0-bath manufactured listed at $165k.
- At list price, monthly cash flow is $517 ($6k/yr) — positive.
- The deal already cash-flows at list — no discount required.
- Meets the 1% rule at list price ($2k rent vs $165k).
- It's been on market 18 days — a 2% lower offer ($163k) is reasonable based on typical stale-listing flexibility.
- Recommended offer: $163k (1.5% below list) — sets the bar for market timing.
- In year one you build about $18k of equity ($1k loan paydown + $16k appreciation (10.0% local appreciation)).
- Location reads 67/100 on livability (#545 in TX) — a middle-class / working-renter tenant base. Strengths: cost of living A+, housing A+, crime B; Watch: health & safety C-, amenities F, commute F.
- Grape Creek ISD (rural): math 25% / reading 29% proficiency, ranked #675 of 826 in TX (top 82%) — low school quality limits family demand, transient renter base, plan for 1-2y turnover.
- Zoned schools: Grape Creek Pri (316 students, 74% FRL); Grape Creek Middle (math 18% / reading 26%, grade F, #1,360 of 1,662 statewide, top 83%, 270 students, 60% FRL); Grape Creek H S (math 27% / reading 37%, grade F, #1,044 of 1,632 statewide, top 66%, 308 students, 63% FRL).
- Market conditions: Rents rising fast (+5.8%/yr); 331 active listings in the ZIP; 233 units permitted in Tom Green County in 2024 (0 in 5+ unit buildings).
- Tom Green County population projected at +35% by 2050 — long-run rental-demand tailwind backs the buy-and-hold thesis.
- At projected returns (10.0% appreciation + 5.8% rent growth), your $46k cash investment doubles in ~2 years — after that, you're playing with house money.
- By year 3, paydown + projected appreciation supports a ~$45k cash-out refi (75% LTV) — recoverable capital for the next deal without selling this one.
- Climate carrying-cost: severe wildfire risk; extreme-heat days projected 7→24/yr by 2055 (HVAC capex compounding) — expect insurance premiums to compound above CPI over the hold.
- Cap rate 10.1% vs local median 2.6% in Grape Creek — top-decile yield for the area; either an underpriced asset or a hidden risk that comps aren't pricing in. Stress-test before assuming the spread holds.
- This rent runs 33% of the median local income ($69k/yr) — at the standard rent-burdened threshold; future hikes will face affordability resistance.
Questions for listing agent
- Is there a deadline driving the sale (1031 exchange, divorce, estate, relocation)? That informs how much negotiation room exists.
- Schools are F-rated, which usually means shorter tenancies and higher turnover. Who's the typical renter profile here, and what's been the actual vacancy rate?
- What's the average days-on-market for RENTAL listings here right now (not sales)? A rising rental-DOM trend means longer vacancies and softer asking-rent achievability than the comps imply.
- What's the recent tenant-quality profile in this submarket — average credit score on applications, eviction rate, late-payment / NSF rate, and stable-employment percentage? A property-management company in the area should have these aggregated.
- How much new for-sale + rental construction is in the pipeline within 1–3 miles? Heavy new supply typically softens prices + rents 12–24 months out; constrained supply supports both.
CashFlowRE · CFR-KEM2SC2VCTSRJZ
· Data 1 day ago
cashflowre.app · 2026-05-29