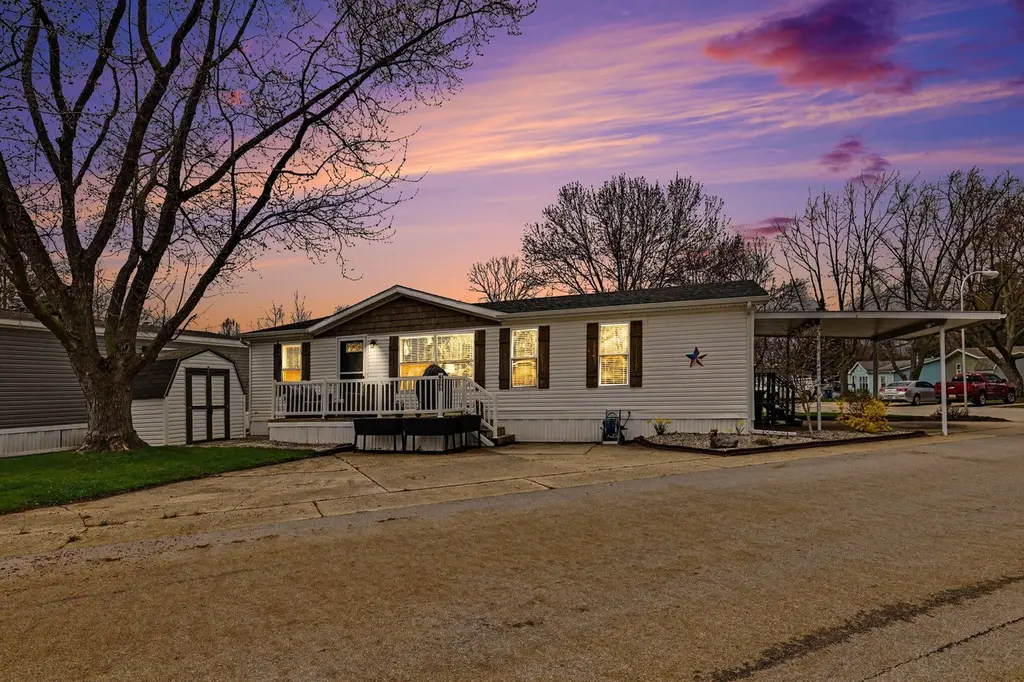
4595 Quebec Ave SW
Wyoming, MI 49519
$129,900D
4 bd · 2.0 ba ·
1,224 sqft ·
Built 2002
· Manufactured
· Pending
· 8 DOM
Cashflow @ list (25.0% down · 7.5%)
Estimated rent
$2,085/mo
Mortgage (P&I)
−$681
Tax + insurance
−$216
HOA
−$773
Vac / Maint / Mgmt
−$438
Net cashflow
$-24/mo
Annual
$-287/yr
Cap rate
6.07%
Cash-on-cash
-0.79%
DSCR
0.96
1% rule
1.60%
Cash to close
$36,372
Investor read
- This is a 4-bed/2.0-bath manufactured listed at $130k. Condition is rated good.
- At list price, monthly cash flow is $-24 ($-287/yr) — negative.
- To cash-flow at today's rent, offer at most $126k (2.7% below list).
- Meets the 1% rule at list price ($2k rent vs $130k).
- Only 8 days on market — expect competitive offers; lowballing is unlikely to land.
- Recommended offer: $126k (2.7% below list) — sets the bar for cash-flow.
- Local home prices are declining (-3.0%/yr); year-one equity from $898 of loan paydown is wiped out by about $4k of value loss. Plan a longer hold.
- Location reads 77/100 on livability (#126 in MI, #3,095 nationally) — a middle-class / working-renter tenant base. Strengths: cost of living A+, housing A+, health & safety A+; Watch: crime D-, amenities F, commute F.
- Grandville Public Schools (suburban): math 49% / reading 61% proficiency, ranked #70 of 540 in MI (top 13%) — acceptable for families but not a draw, mixed tenant base, ~2y average lease.
- Zoned schools: Grandville Middle School (math 44% / reading 69%, grade B, #70 of 493 statewide, top 14%, 830 students, 36% FRL).
- Watch-outs: HOA is 37% of rent.
- Market conditions: Rents rising fast (+10.5%/yr); 94 active listings in the ZIP; 4 comparable units currently listed for rent nearby; rentals leasing fast (median 5d on market — plan ~1-2 weeks tenant-placement turnaround); 2,253 units permitted in Kent County in 2024 (969 in 5+ unit buildings).
- Kent County population projected at +22% by 2050 — long-run rental-demand tailwind backs the buy-and-hold thesis.
- 3 sale attempts with the ask held roughly flat each time — persistent listings suggest the price (not the market) is what's stuck; bring a comps-based counter.
- At projected returns (-3.0% appreciation + 8.0% rent growth), your $36k cash investment doubles in ~10 years — after that, you're playing with house money.
- Cap rate 6.1% vs local median 3.8% in Wyoming — top-decile yield for the area; either an underpriced asset or a hidden risk that comps aren't pricing in. Stress-test before assuming the spread holds.
- This rent runs 34% of the median local income ($74k/yr) — at the standard rent-burdened threshold; future hikes will face affordability resistance.
Questions for listing agent
- What do current leases actually rent for vs. the listed asking? Can we see a recent rent roll and the last 12 months of T-12 income?
- What does the HOA fee cover, when was the last increase, and are there any pending special assessments or reserve-fund shortfalls?
- Is there a deadline driving the sale (1031 exchange, divorce, estate, relocation)? That informs how much negotiation room exists.
- Schools are D-rated, which usually means shorter tenancies and higher turnover. Who's the typical renter profile here, and what's been the actual vacancy rate?
- Crime grade is D in this area — have there been break-ins, vandalism, or insurance claims at this property in the last 3 years? What carrier currently insures it and at what premium?
- The area grade is low — what's the realistic commute time and amenity access for the typical tenant pool here? Any planned neighborhood developments (good or bad) we should know about?
- What's the average days-on-market for RENTAL listings here right now (not sales)? A rising rental-DOM trend means longer vacancies and softer asking-rent achievability than the comps imply.
- What's the recent tenant-quality profile in this submarket — average credit score on applications, eviction rate, late-payment / NSF rate, and stable-employment percentage? A property-management company in the area should have these aggregated.
CashFlowRE · CFR-KJBR6C3JG7Z9MR
· Data 4 weeks ago
cashflowre.app · 2026-05-29